Posted on

Visual Programming Environment Based on Hypergraph Representations

Peter Kapec

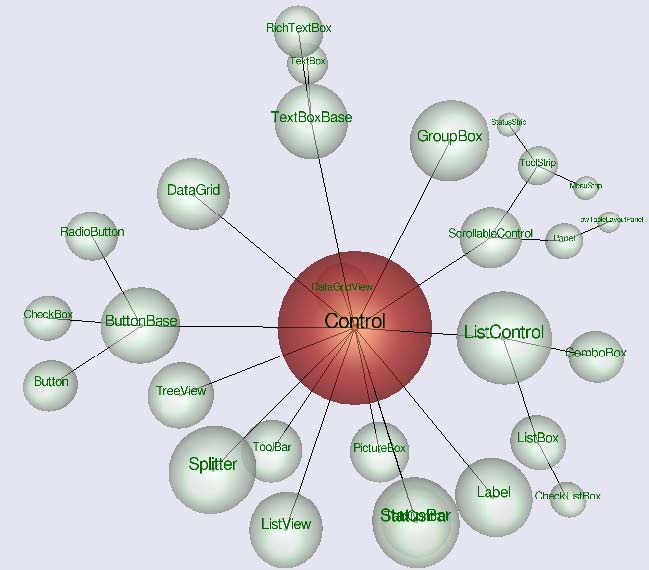
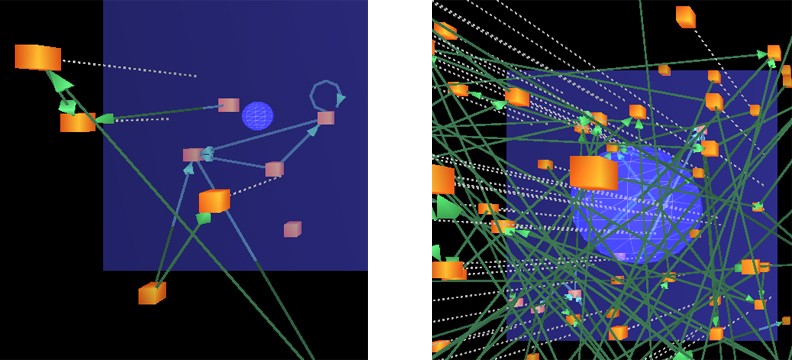
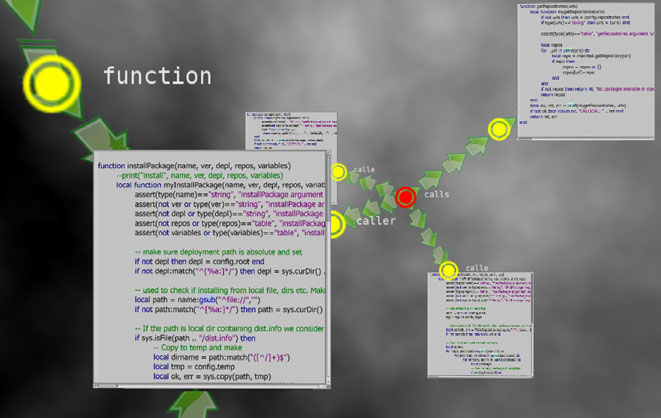
Abstract. In this paper we present a concept of a visual programming environment that uses hypergraphs for representing, querying and visualizing software artifacts. The hypergraph representation allows to store semantic relations between software artifacts an can be visualized with well-known graph drawing algorithms. The proposed visual programming environment focuses not only on software visualization, but also offers context visualization for programming tasks.We present visualizations of an existing software system and demonstrate how contextual information can be displayed when browsing and modifying source code artifacts.


Kapec, Peter: Visual Programming Environment Based on Hypergraph Representations.
In: ICCVG 2010 – Lecture Notes in Computer Science: International Conference on Computer Vision and Graphics
Warsaw, Poland, September 20-22, 2010 Proceedings, Part II (2010), ISSN 0302-9743, Vol. 6375 – Berlin : Springer-Verlag Berlin Heidelberg, pp. 9-16

Posted on

Metaphorical Visualizations of Graph Structures

L. Ukrob, M. Jakubeci, P. Kapec

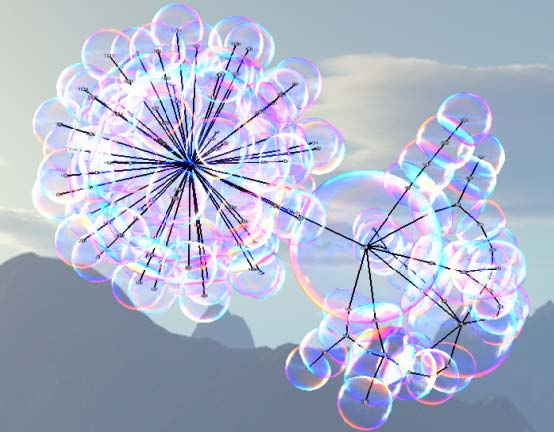
Abstract. Data visualization of large abstract data sets and complicated relations is a complex research area with different problems and constraints. Often simple shapes and structures are not very eye-pleasing. Visualization metaphors, which create a mapping between a well-known problem domain and a new complicated problem domain, can produce interesting visualizations. In this paper we propose two metaphorical visualizations of graphs and multidimensional data: we propose a metaphor of soap bubble clusters to visualize graphs and a nebulae (sky) metaphor, which uses nebulae and stars to visualize graphs and multidimensional data.


Ukrop, Ľ., Jakubéci, M., Kapec, P.: Metaphorical Visualizations of Graph Structures,
In: GraVisMa’2010: 2nd International Workshop on Computer Graphics, Computer Vision and Mathematics,
Brno, Czech Republic, September 7-10, 2010, ISBN 978-80-86943-85-5, pp. 115-122

Posted on

New approaches in graph visualization

Ľuboš Ukrop

Abstract. Presented thesis deals with the field of information visualization. Lots of information has structural character with some kind of relations. This type of information could be naturally represented by graph, often in form of tree-like, hierarchical structure. The aim of this thesis was to introduce different algorithms for visualization of such structures in three dimensions and to design an experimental algorithm, which will visualize hierarchical structure reaching the shape of a soap bubble cluster. After the exploration of existing hierarchy visualization solutions a dynamical algorithm was created. It is based on the spring model, which was determined as the most appropriate technique for this task. For demonstrational purposes simple interactive visualization system was implemented. The process of system and algorithm development, along with capabilities and issues connected with its use, is discussed in detail.

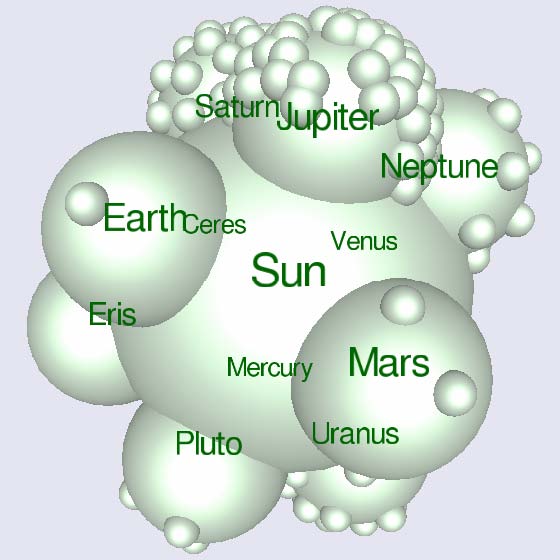
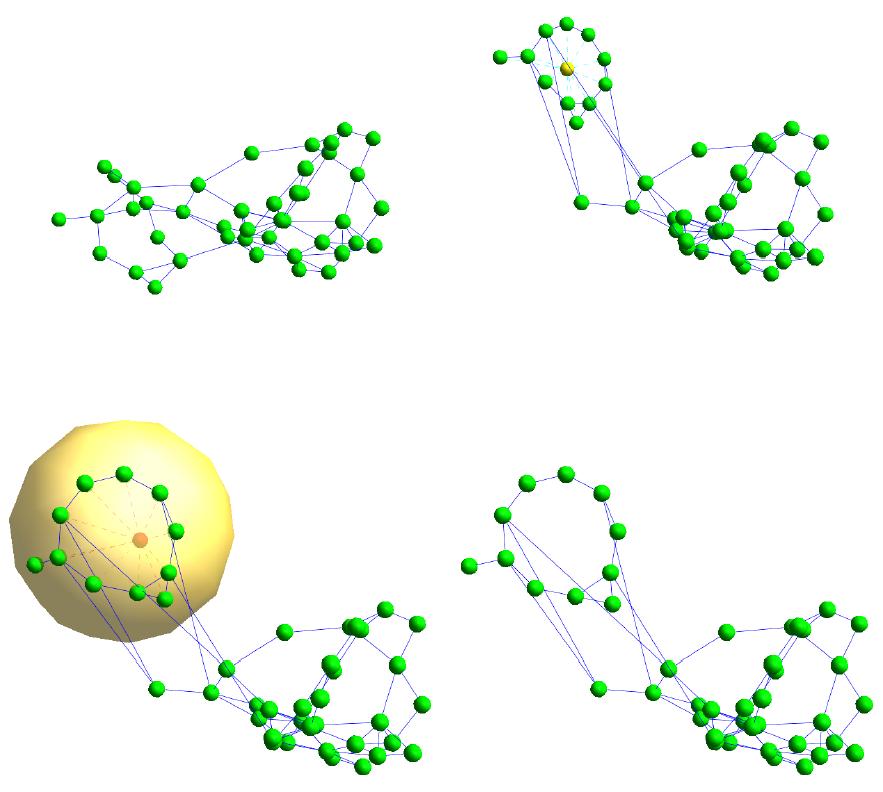
Visualization without transparent nodes.
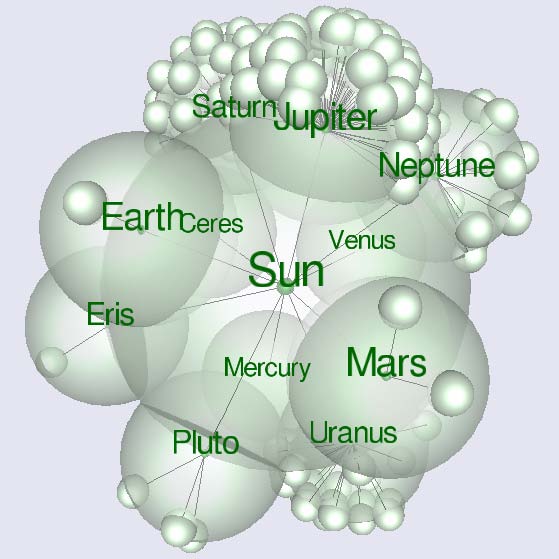
Visualization with transparent nodes.
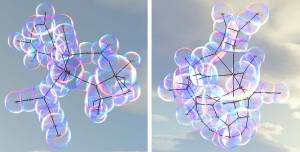
Visualization with standard string length.
Visualization with modified string length.
Posted on

Interactive browsing of multimedia content in 3D space

Peter Mindek

Abstract. Subject of this project is visualization and interactive manipulations with multimedia data in a virtual 3D space. High amount of multimedia data requires more and more sophisticated applications capable of comfortable browsing of this data. The thesis focuses on existing applications, which are serving this purpose, mainly on those using 3D graphics. However, individual techniques used in the field of information visualization, such as graph representation of multimedia or focus+context techniques, are discussed as well. Since state-of-the-art multimedia applications cannot do without animations, the thesis also deals with several techniques used in computer animation. Output of this project is an application capable of easy and spectacular browsing of multimedia files stored on a hard drive or other storage device. The animations used for multimedia browsing are scriptable with Lua scripting language. User can define his or her own methods of displaying multimedia files that way.

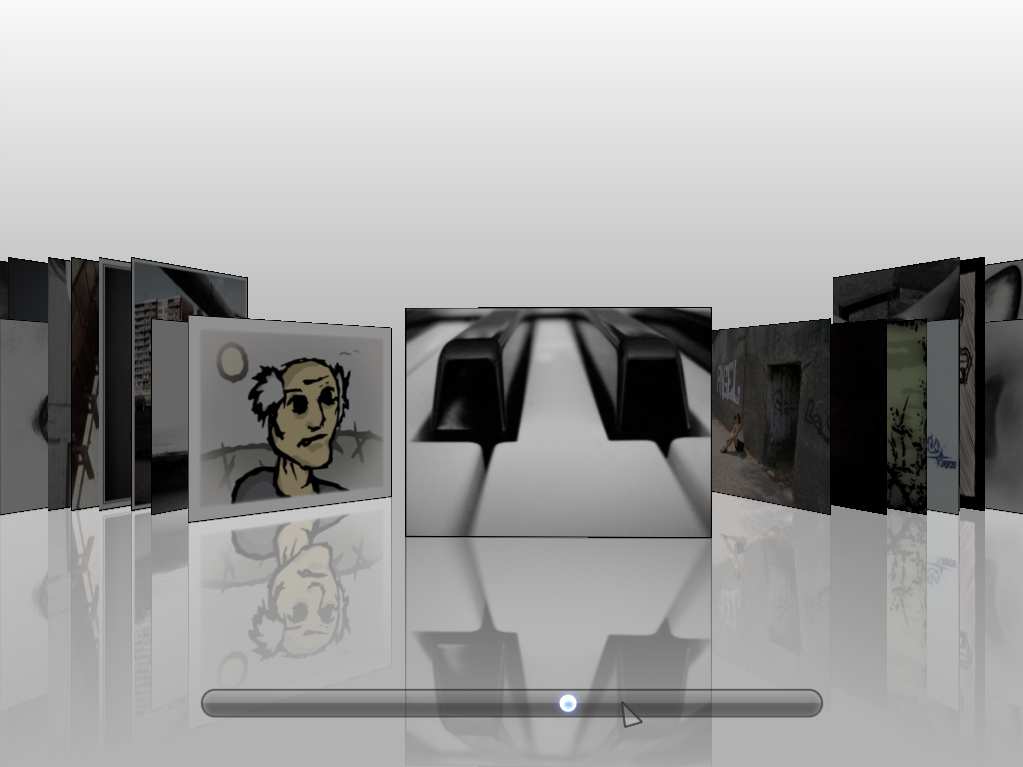
Slideshow mode.
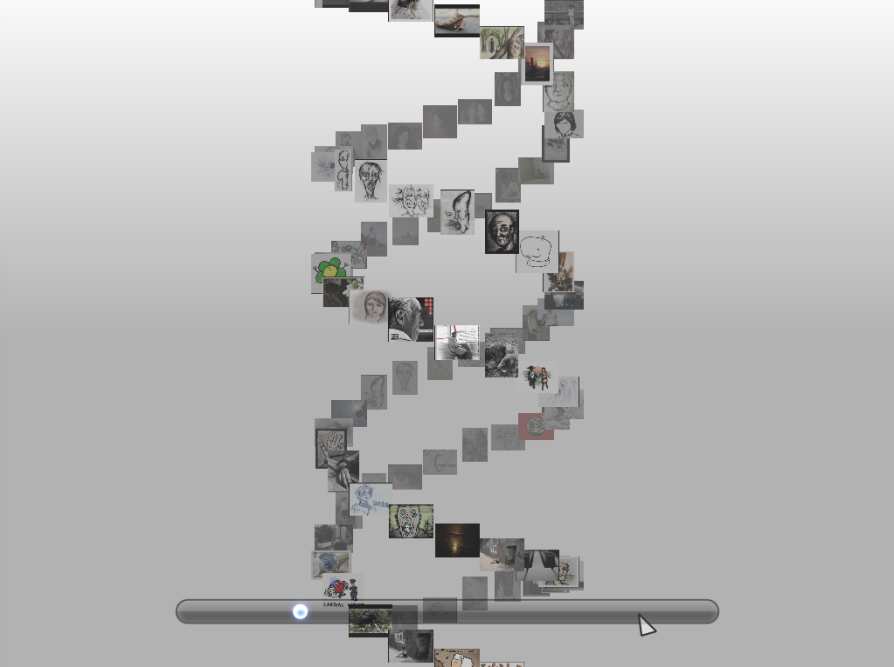
Animation script – double spiral.
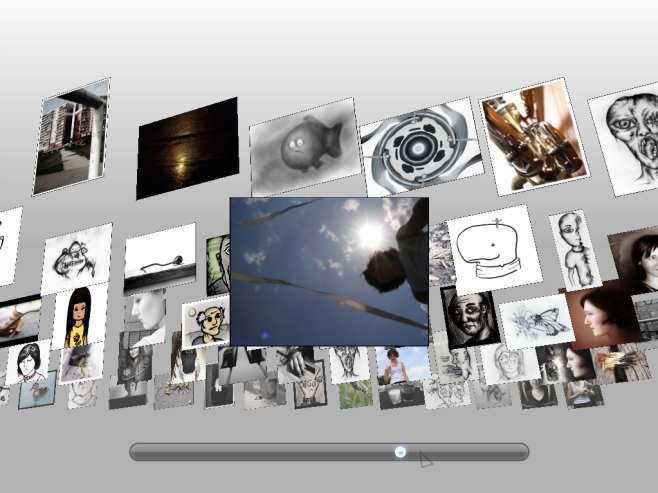
Animation script – 3D wall.
Posted on

Interactive browsing of multimedia content in 3D space

Eduard Kuric

Abstract. The bachelor project describes existing interactive 3D user interfaces, visualization techniques and methods for manipulating and browsing of multimedia content in 3D space and discusses these solutions for purpose of possible improvment. This project includes survey of methods of organization data in 3D space and available support libraries for developers, too. The result of project is an application Vilcacora for browsing of multimedia content with a support of physical environment and simulation of real actions.

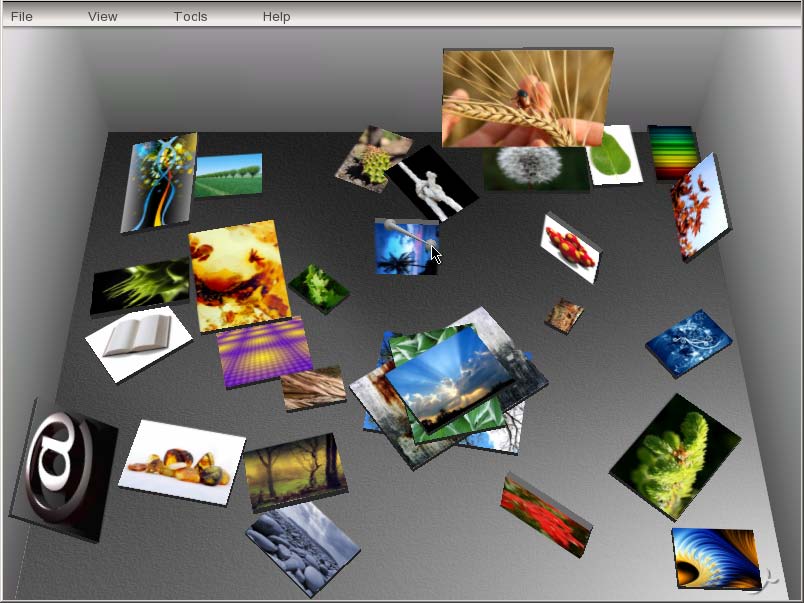
View to the desktop, loaded images were moved, rotated, resized by user interaction.
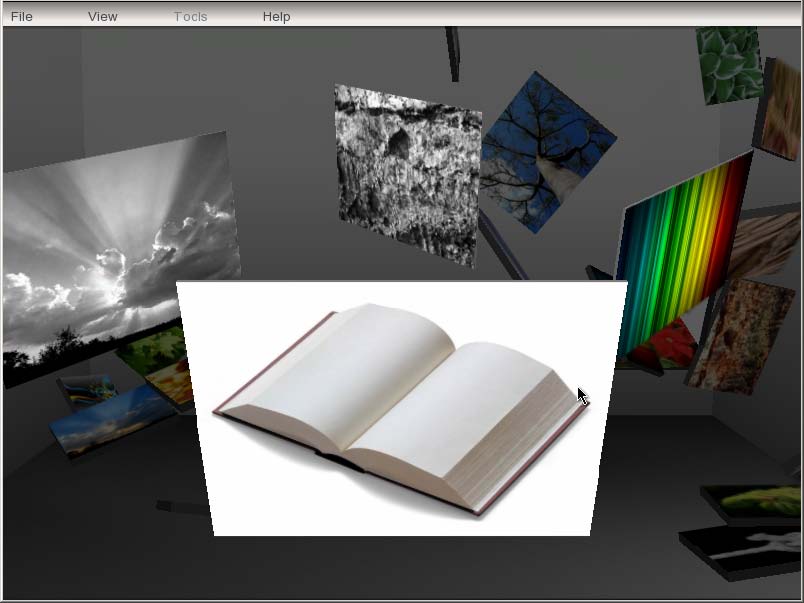
View to scene of picture overview. In the background is desktop with levitating pictures.
Posted on

Interactive manipulation with 3D graphs

Martin Ľudvík

Abstract. The objective of this project is to analyze current situation in domain of graph visualization and manipulation in 3D space. It is finding alternative approaches to such a manipulation and tries to demonstrate them using simply system, as well.

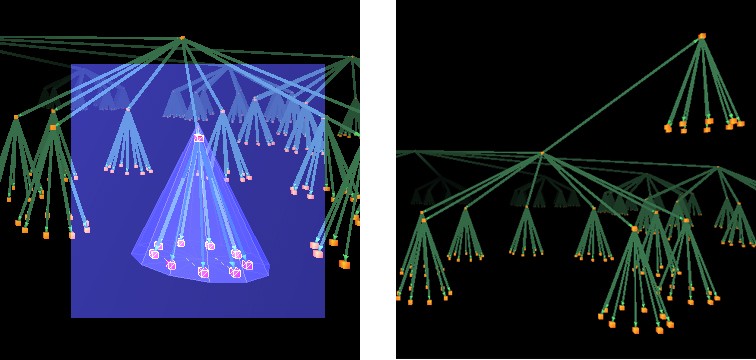
Nodes placement using cone selection cursor.
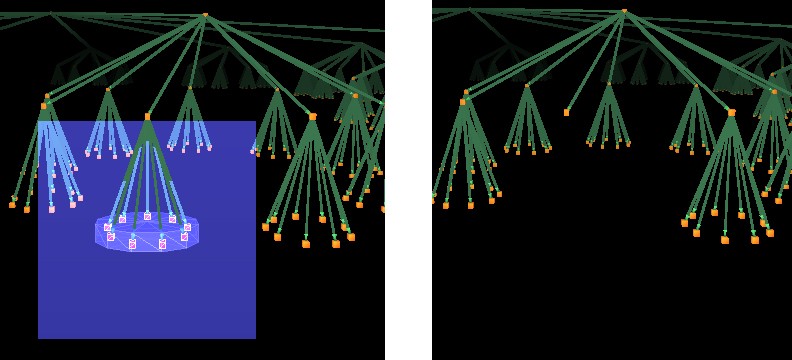
Deleting node’s children using a cylinder selection cursor.
Helper lines that project nodes onto selection planes.
Posted on

Constraints in Force-directed Graph Visualization

Jakub Ukrop

Abstract. Presented thesis deals with graph drawing methods based on spring embedder. The aim of this thesis is providing the summary of existing force-directed algorithms and designing a system for three-dimensional graph visualization. The system will provide automatic and manual constraining possibilities, in order to produce various specific graph layouts (e.g. walls, spheres, cylinders etc). In addition, it will demonstrate the possibilities of graph or subgraph modifications by means of the insertion and manipulation of additional (dummy) nodes.

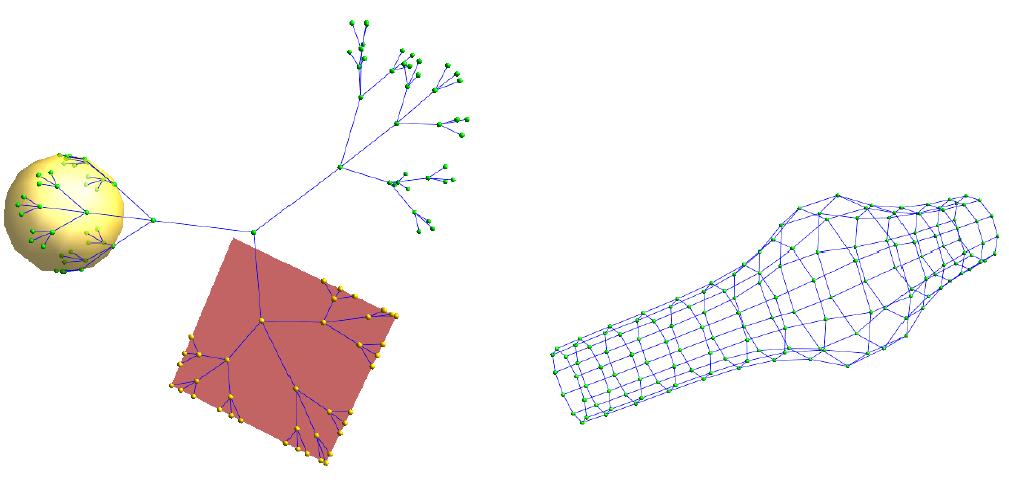
Application of restrictions by entities.
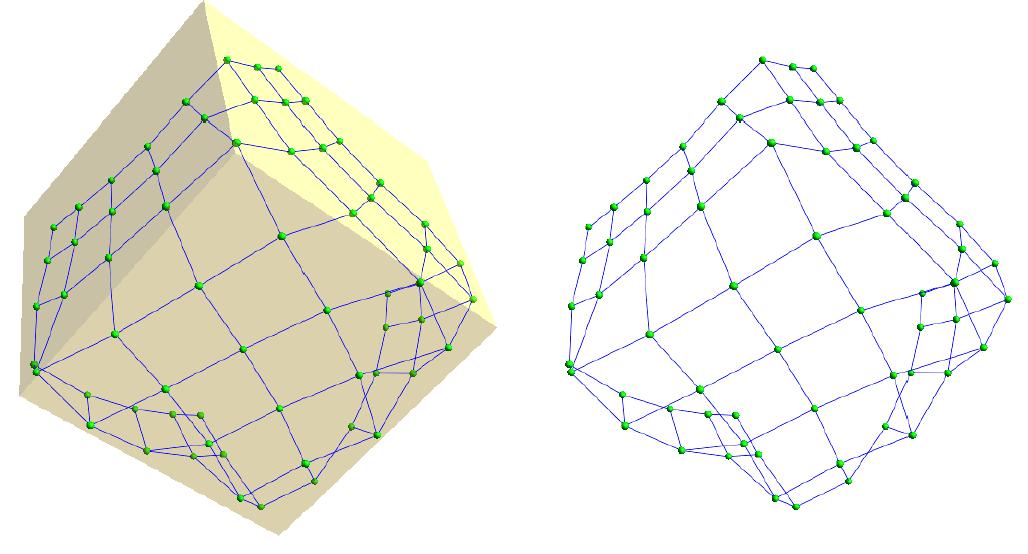
Restriction by cube.
Example of restriction usage on better visualization of chosen node set.
Posted on

Visual data mining in software

Bc. Filip Komorovský

Abstract. The main task of visual data mining in software is to speed up the process of obtaining information from software projects. The more complex the software project is, the more time is needed for new engineers to fully understand its structure, so they can start to implement additional features. That is why there is a demand for tools which could help programmers and software engineers understand these new projects in shortest possible time, so they could start to work on it effectively.

In this work we analyzed existing approaches for software visualization and visual data mining. A new way of software visualization is proposed, which enables interactive data mining from software projects. Visualization works with software systems developed in C# programming language. Proposed tool creates a model which is then used for interactive visual data mining. This model is represented by graph structures visualized in 3D space. Visualization is interactively driven by user requirements. The result of this thesis is a tool developed for software engineers, designated for visual and interactive data mining in software projects.

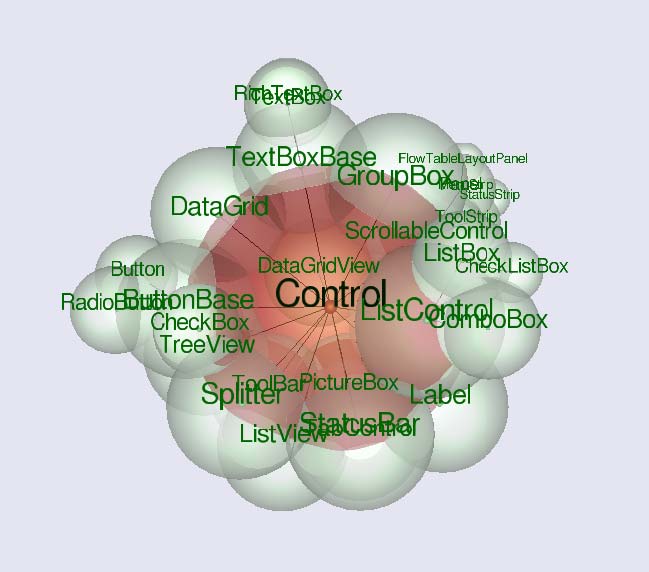
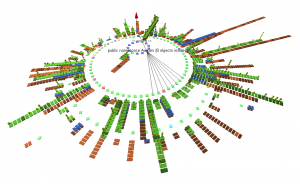
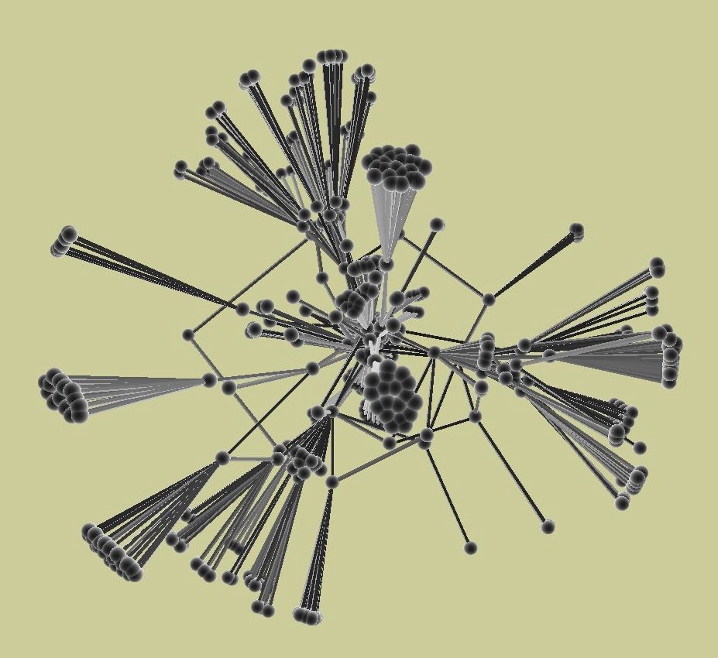
A visualization of an existing software system implemented in C#
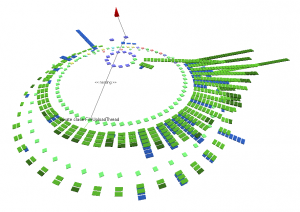
Showing only classes sorted by number of methods
Posted on

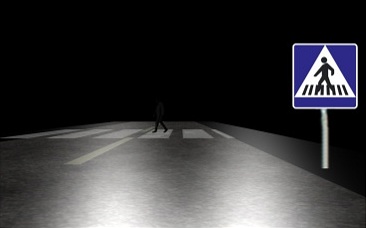
Reaction time evaluation with a car driver assistance system

Adam Valent, Filip Å tiglic

Abstract. The aim of this project is a coope ration of two works. The first one is an assistance system for the driver, which detects and recognizes road traffic signs with a camera mounted in a moving vehicle and alerts the driver afterwards. The second work provides an experimental simulation environment, which allows evaluating the current level of driver’s awareness by monitoring the driver’s reactions. The goal of this project is to compare reaction response times of the driver with the assistance system turned on and off. Both works are in the last phase of implementation, which will be followed with an extensive testing on humans.

System architecture
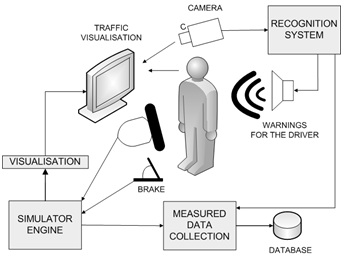
Assistance system architecture
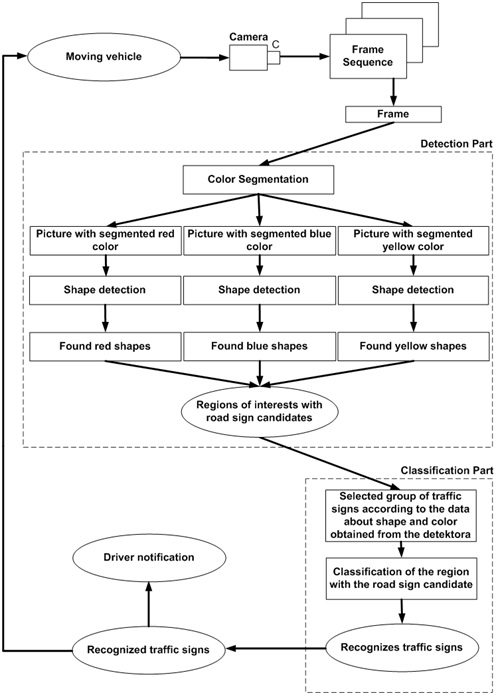

Detection

The detection part is responsible for detecting the areas with the candidates for traffic signs in a specific frame captured by camera. The process of detection is consisting of several steps. In the first step we use a color segmentation in which the colors specific for traffic signs are segmented to distinguish the colors of the traffic sign from the color of the environment. In the next step Canny edge detector is used to detect edges and in the last step Hough transformation is used to detect individual shapes.

Since the results of the detection part are the areas with the candidates of known shape and color, the detection part will be also used as a pre-classifier for the classification part. For this reason we decided to create a model of traffic sign groups of specific color and shape.
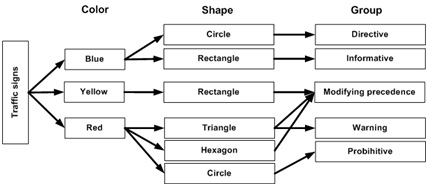
Classification part

The classification part is responsible for the classification of the areas with the candidates obtained from the detection part by comparing them with the template signs stored in the database. In order to be able to compare the area with the template sign from the database it is necessary to use a method, which will be fast enough, effective and invariant to the changes of scale, rotation and various lightning condition.

We decided to use the novel method introduced in 2006 – SURF [3] (speeded up robust features) which is a performant scale and rotation invariant interest point detector and descriptor. It approximates or even outperforms previously proposed schemes with respect to repeatability, distinctiveness, and robustness, yet can be computed and compared much faster.

Simulation enviroment

Paper

Poster
 

Posted on

Hand Tracking and Gesture Recognition Using Echo State Neural Networks

Peter Fillo

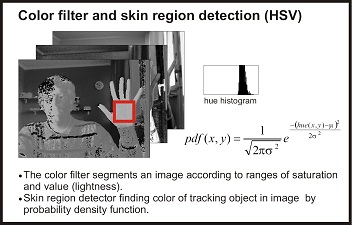
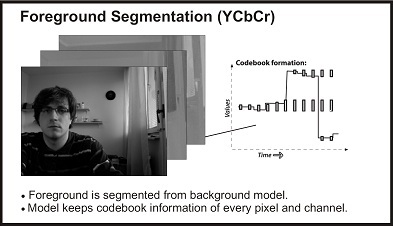
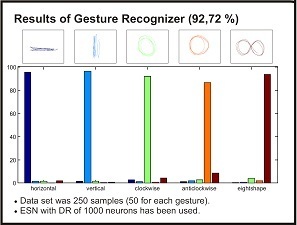
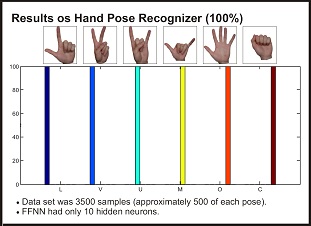
Abstract. Tracking an object in a video sequence is a complex problem which presents one of the fundamental task of image processing. One of the many use cases is controlling using hand gestures in Human-Computer Interaction. This paper introduces real-time hand recognition and tracking in video sequence with a classification of performed hand gestures. Hand recognition is based on foreground segmentation and skin region detection. Attributes of hand movements are being recorded and used as an input to a echo state neural network which performs hand gesture classification. Work presents proposed tracking algorithm and first results of gesture recognition.

Echo state neural networks

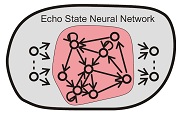
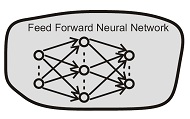
The echo state neural networks (ESN) can solve many problems based on time context. ESN networks are the special type of recurrent neural networks (RNN), but the randomly initialized hidden layer contains a high number of neurons, called dynamic reservoir (DR).

Training ESN

The training of ESN networks consist of following steps, outlined by [6]:

  1. Initialization an untrained ESN which has the echo state property.
  2. Sample network training dynamics
  3. Compute output weights

Hand tracking algorithm and implementation

Gesture recognition and experiments


IITSRC 2010

Poster
Posted on

Library for graph visualization in 3D space

Peter Kajan
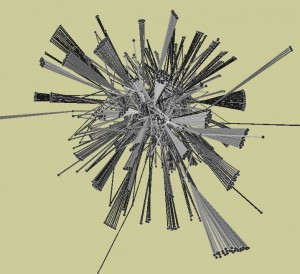
Abstract. The presented thesis deals with the visualization of large graphs. Chosen dynamic graph layout algorithms are analyzed in this paper. Algorithms computed on GPU are also mentioned and one of them is analyzed. Further, this paper deals with rendering optimization using scene graph. The goal of this thesis was to design and implement system able to visualize large graphs in 3D space using one of the analyzed layout algorithms and one of the scene graphs. The system has been tested on the set of graphs with known and unknown shape. It achieves “nice”drawings of graphs up to 5000 vertices in satisfying period of time. Results are presented at the end of this paper.
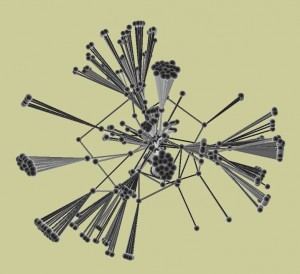
Enslyon (2682 nodes).
Veolia (639 nodes).
Graph illustrating small world (100 nodes).
Graph illustrating sending mail between people during year.
Posted on

Visualizing graph structures using soap bubbles

Bc. Ľuboš Ukrop

Abstract. Lots of information has structural character with some kind of relations. This type of information could naturally be represented by the graphs. A common way to enhance human understanding of graph is to visualize it. Many studies have already been devoted to this area, with most of them following conventional graph drawing techniques. In this thesis we present an experimental algorithm based on the springembedder technique, which tries to visualize graph structures using realistically rendered 3D soap bubble clusters. For its demonstration, a simple interactive visualization system was implemented. The process of system and algorithm development along with capabilities and issues connected with its use is discussed in detail.
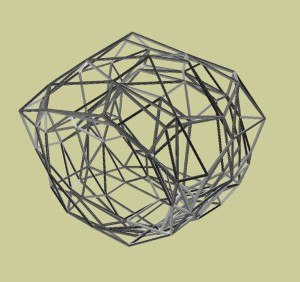
Visualization of chosen graphs from Rome set.
Visualization without space restrictions.
Visualization with active space restrictions.
Visualization of software artifact graph.