Posted on

Creating and Recognizing Visual Words Using Sparse Distributed Memory

Ján Kvak

POSTER

Abstract. In this paper we propose a way to create a visual words using binary descriptor and to cluster and classify them from input images using Sparse Distributed Memory with genetic algorithms. SDM could be used as a new approach to refine clustering of binary descriptors and in the same algorithm create a classifier capable of quick clustering of this particular input data. In the second section we propose to add a binary tree to this classifier to be able to quickly classify input data to predefined classes.

Introduction

The image recognition and classification is becoming an area of huge interest lately. However the reliable and fast algorithm that could recognize any object in input scene as fast humans are able to do, is still something to be discovered. For now the algorithms are always tradeoffs between reliability, speed and number of classes that can be recognized.

As the object recognition capability is something, that we want to approximate, we can study the principles of human thinking and object categorization, to use them in image recognition algorithms. Because the human language and word recognition is well studied area, the principles of recognizing human speech can be used in object recognition [1]. We can treat object classes as words that can represent clusters of descriptors, which are good for recognition.
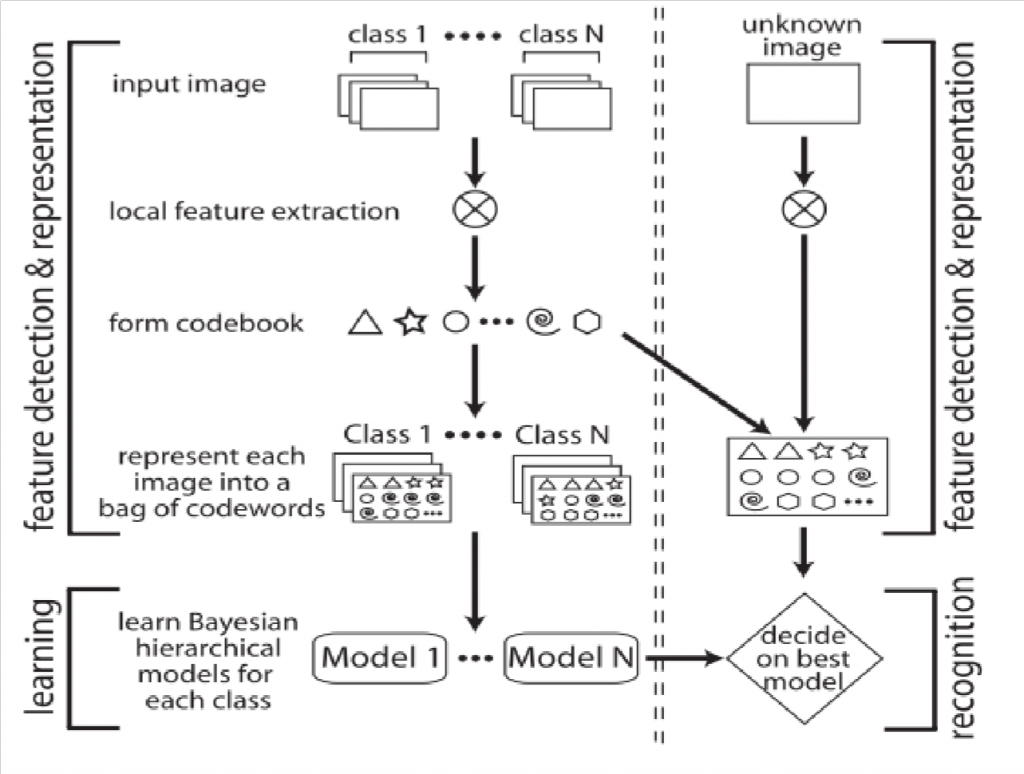
Figure 1. Flow chart of the algorithm (2).

In [2] authors provide a chart representing general algorithm of creation and usage of bag of words. This algorithm is illustrated in Figure 1. Their approach to creating and using visual words is to extract local descriptors from a set of input images divided to N classes. Then they clustered this set of local descriptors using K-means algorithm. Clustering provided them with “codebook” of words, in which the words were centers of clusters. Then each image can be represented as a

“bag of visual words”. These bags of words can be trained into classifier. Authors used hierarchical Bayesian models. In different work [3] Naive Bayes classifier and SVM were used for this purpose.

In these works, SIFT local descriptor was used to describe keypoints found in input images. SIFT has become de-facto standard in local descriptors area and all new ones are compared to its capabilities. One of major drawbacks of this local descriptor is, that it is relatively slow to compute, so for a practical use, the approximations like SURF has emerged. Among the new local descriptors that are regularly compared to SIFT, are binary feature descriptors like ORB, BRISK and FREAK. These descriptors are represented with vector of bits, so they can be compared and stored efficiently and quickly. In this work, we will use the latest one FREAK, which capabilities are compared to SIFT in [4].

We can now use the fact, that all local features are represented as binary vectors. Clustering and classifying now takes place in Hamming space, because we can compare these features using Hamming distance. For this purpose we propose the use of Sparse Distributed Memory (SDM) augmented with genetic algorithms also called genetic memory[5].

Genetic memory

In [5] genetic memory was used to predict weather. Weather samples were converted to vectors of bits and trained to memory. It is a variation of Kanerva’s Sparse Distributed Memory (SDM) augmented with Holland’s genetic algorithms. SDM takes advantage of sparse distribution of input data in high-dimensional binary address space. It can be represented as a three – layer neural network with an extremely large number of hidden nodes in middle layer (1,000,000 +) [5]

SDM is an associative memory, which purpose is to store data, and retrieve them, if address we call is sufficiently close to the address, at which data were stored. If the address we call is sufficiently close to the address, at which data were stored, the associative memory, in this case SDM , should return data with less noise, than the noise in the original address. [6]

Figure 2. Structure of Sparse Distributed Memory (5).

Figure 2 shows a structure of SDM. We can see that it consists mainly from two parts – location addresses and n-bit counters. It has constant radius that describes maximum distance to location address, in which this address is still selected. Then, we have reference addresses, which denote the classes, we want to train. The fact worth noting is that the number of reference addresses is much bigger than the number of location addresses.

When training, we need training data that belong to each one of reference addresses. In Sparse Distributed Memory, the location addresses, which distance in Hamming space is smaller than radius of memory, are selected. For one reference address it is usually more location addresses. Then training data, belonging to reference address are used to alter the counters in selected location addresses. If that particular bit in training data is 1, counter is incremented, in the case of 0, counter is decremented.

Reading from memory means, that we need input address that we want to correct. Output of this procedure should be the reference address that this input belongs to. This input is compared to each one of location addresses and the ones, closer than radius to the input address, are selected. Counters from selected addresses are column wise summed. The sum is then converted to bit vector that is the reference address.
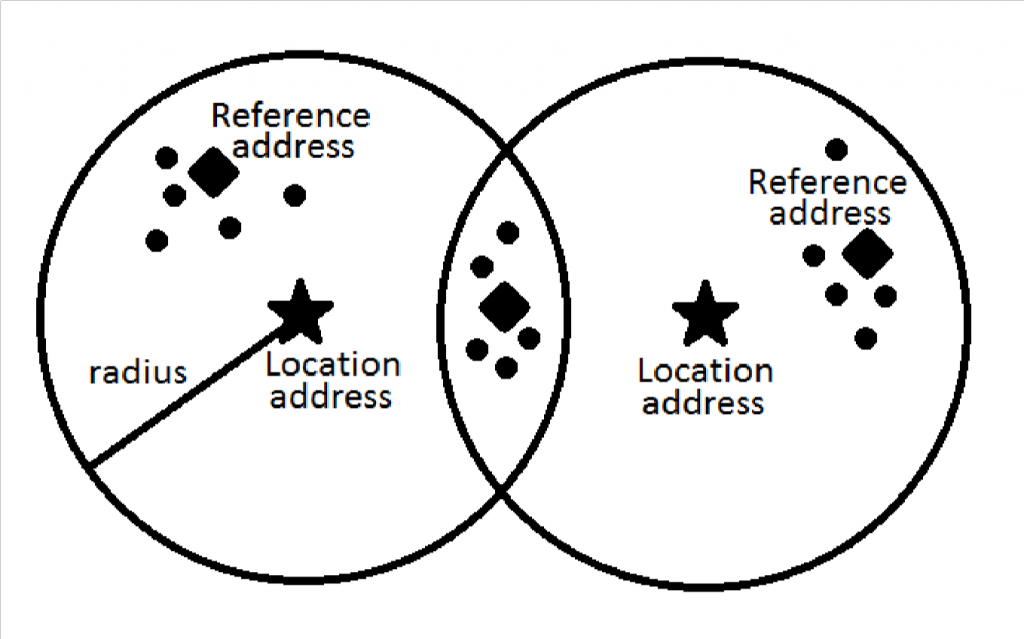
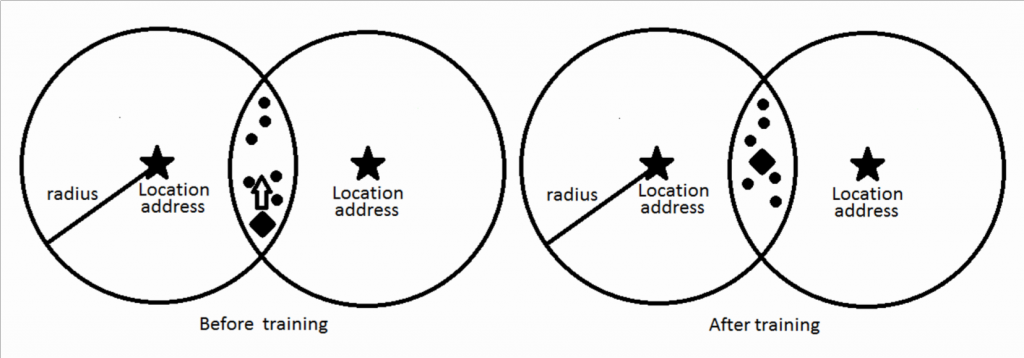
Figure 3. Visualization of SDM.

In Figure 3. we can see visualization of Sparse Dispersed Memory working principles. Marked by a star, there are two location addresses. Around them, we have an area, denoted by radius, which show the addresses that belong to that particular location. Reference addresses are marked by a diamond. Dots mark data that belong to that particular reference address.

From this visualization, we can see, that to represent three classes (three reference addresses) we need only two location addresses.

The problem is how to choose location addresses, to represent well the data that we want to classify. This is why authors of [5] used Holland’s genetic algorithm to choose the location addresses, that would be best to represent the input data classes.

In the beginning, the location addresses are filled with random bits. After training each of the input classes, we compute fitness function for all of the location addresses. Fitness function states, how good is the location at representing input data. Then two of the location addresses with the best rating according to fitness function are chosen to create a new address, which can then replace the address with lowest rating. Genetic combination is made at one or more crossover points.

Figure 4. Crossover of addresses (5).

Using this algorithm, locations after multiple generations should evolve towards the ones that are best to represent input reference addresses and corresponding input data. Other consequence is, that after training, the reference address on the output of memory is also moving towards the address more representing  input data. The output of counters effectively average[7] the data given in input, so the reference address is in the “middle” of classified data.

Figure 5. Refinement of reference address (5).

In the Figure 5 we can see the reference address before training and after training of data. So training of genetic memory have two important results – it creates location addresses, that can represent input data and they refine reference addresses from input, so they can be better recognized by this particular SDM.

Forming of codebook

We propose to use genetic memory to create and train visual words. First we must roughly choose the reference addresses that can be than used to train SDM. That can be done using clustering algorithm like K-means. Then after they are trained to SDM and multiple generations of genetic refinement are used to create the best possible locations, to classify this particular codebook. After this is done, when we try to read from trained SDM, we need to present it with input bit vector obtained from the classified point in image. However this kind of memory after fixed number of steps, which is lower than the number of visual words, gives us only a bit vector, which is a reference address. But for the purpose of visual words, we need to get the number of the reference address, not the complete vector. Observing the SDM, we can say, that always the one combination of local addresses belong to one class which can be denoted by a number.

To this end, we could use simple binary tree. Every level of the tree should belong to one of the location addresses. The leaves of the tree will be marked with numbers of reference addresses. As we can see from Figure 6 the input data vector that we need to assign to one of the classes, (one of the visual words) is  compared to all of location addresses. After each comparing, we move to the next node of the binary tree according to the result of comparing. In this case we move to the right, if Hamming distance of input vector from location address is smaller than radius, if not, we move to the left. That means, that to assign vector to one of the classes (visual words) we still need only fixed number of steps, that is number of location addresses. This can be a significant save of time, if the number of visual words is large, because number of location addresses << number of visual words.
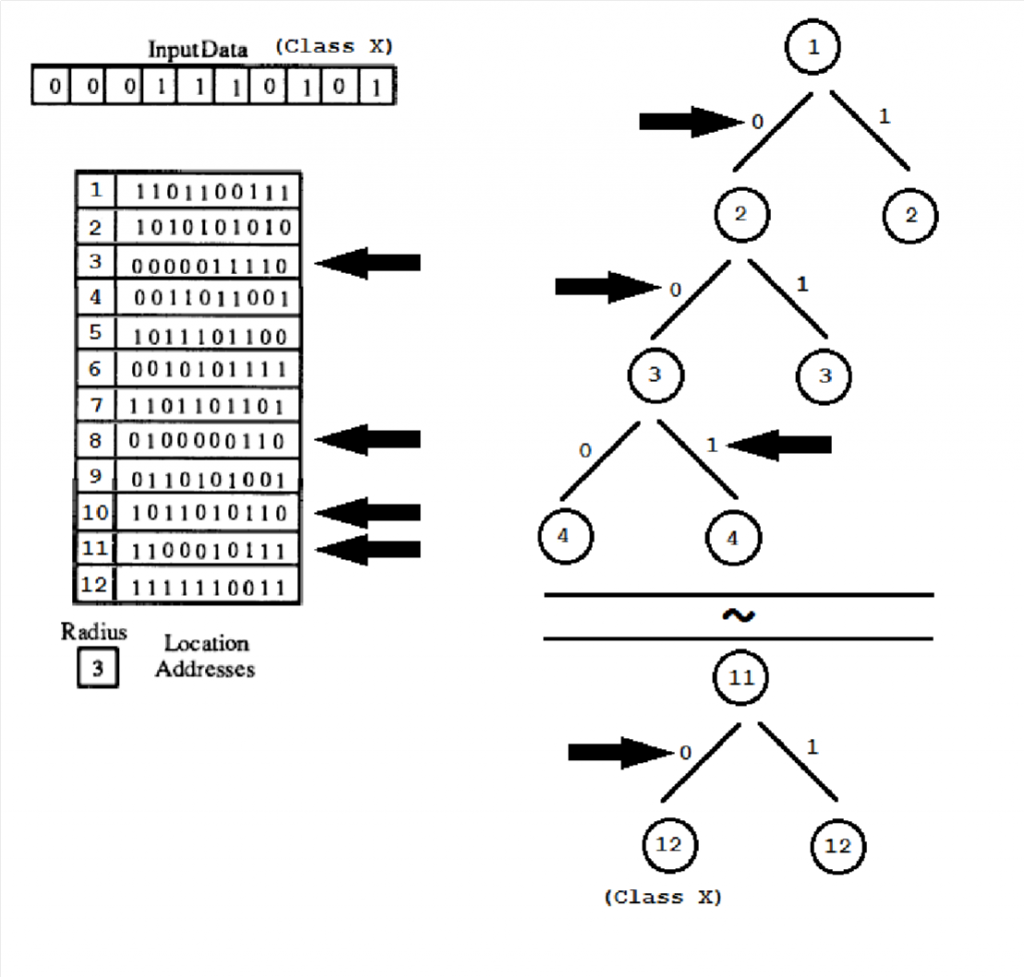
Figure 6. Binary tree for fast classification.

Experiments

We propose an experiment to evaluate this hypothesis. In this experiment, we use the collection of input images, to create a visual word codebook and then to classify them. For this purpose we want to use Caltech 101 image dataset. For the purpose of describing the image points, we can use binary descriptors FREAK and ORB. From this dataset, we can create the codebook using only SDM with genetic algorithms, then using K-means clustering algorithm and refining in SDM and for comparison, using only K-means. Then, after creating the codebook, we compare speed and accuracy of classification of visual words in SDM with classification in Naive Bayes and SVM classifiers.

Preliminary experiments with SDM with genetic algorithms show, that one of the problems with this type of memory is choosing the right fitness function. If the location addresses are set randomly, there is high probability, that without right fitness function, only same two best addresses will be always chosen and the children of this genetic crossover will be positioned only next to small part of reference addresses, thus not effectively describing all of input data. This happens, when the parents for crossover are chosen absolutely[5]. Second option is to choose them probabilistically [5]. The best members are chosen randomly, but proportionally to their fitness function. Other problem is, that in [5] authors did not describe complete genetic algorithm, that requires mutations as well as genetic crossovers. Experiments on smaller data showed, that it is necessary to include genetic mutations to algorithm.

Figure 7. Example of genetic crossover.

As we can see from Figure 7, if the optimal location address contains bits (the ones in the grey part), that are not present in best location addresses from parent generation no type of crossover can create desired result.

Conclusions

We proposed a way of creating visual codebook and to classify image patches described by binary vectors to visual words using Spares Distributed Memory with genetic algorithms. This genetic memory is capable of classifying great number of classes, while maintaining constant number of steps in the process of recognizing. It is equal to a neural network with great number of neurons and it is designed to operate on great number of sparse distributed data in Hamming space. Using genetic memory, we can refine the visual words gained from dataset and, in the same time create classifier, adapted to recognize visual words from that same dataset. Augmenting genetic memory with binary tree, we can get numbers of visual words, instead of their binary vectors, without increasing the complexity and computing time of the algorithm.

References

[1] J. Sivic and A. Zisserman, “Video Google: a text retrieval approach to object matching in videos,” Proceedings Ninth IEEE International Conference on Computer Vision, no. Iccv, pp. 1470–1477 vol.2, 2003.

[2] P. Perona, “A Bayesian Hierarchical Model for Learning Natural Scene Categories,” 2005 IEEE Computer Society Conference on Computer Vision and Pattern Recognition (CVPR’05), vol. 2, pp. 524–531.

[3] G. Csurka, C. R. Dance, L. Fan, J. Willamowski, C. Bray, and D. Maupertuis, “Visual Categorization with Bags of Keypoints,” In Workshop on statistical learning in computer vision ECCV, vol. 1, p. 22, 2004.

[4] A. Alahi, R. Ortiz, and P. Vandergheynst, “FREAK: Fast Retina Keypoint,” 2012 IEEE Conference on Computer Vision and Pattern Recognition, pp. 510–517, Jun. 2012.

[5] D. Rogers, “Weather Prediction Using Genetic Memory,” 1990.

[6] D. Rogers, “Kanerva’s sparse distributed memory: An associative memory algorithm wellsuited to the Connection Machine,” 1988.

[7] D. Rogers, “Statistical prediction with Kanervas Sparse Distributed Memory,” 1989.
Posted on

Planar Object Recognition In An Augmented Reality Application On Mobile Devices

Marek Jakab

POSTER

Abstract. The purpose of our research is to develop an application of augmented reality on mobile device, which will be educative and entertaining for their users – children. User will be asked for an input to take a picture from the book and the application will draw a supplementary information in the form of a 3D object on the screen. The key task of our application is the problem of image recognition on mobile platform using local descriptors. Currently available descriptors included in OpenCV library are well designed, some of them are scale and rotation invariant, but most of them are time and memory consuming and hence not suitable for mobile platform. Therefore we decided to develop a fast binary descriptor based on the Histogram of Intensity PatcheS (HIPs) originally proposed by Simon Taylor et al. To train the descriptor, we need a set of images derived from a reference picture taken under varying viewing conditions and varying geometry. Our descriptor is based on a histogram of intensity of the selected pixels around the key-point in such a way that rotation of the patches could be implemented very efficient in the form of buffer shift. We use this descriptor in the combination with the FAST key-point detector and a sophisticated method of key-points selection is then used with the aim to reduce the computation time.

Introduction

Problem of the visual object recognition using feature matching is one of the most challenging tasks in the computer vision. Nowadays, there are several ways for successfully match a template with an image. Most of these methods are quite robust, however they are still complex and most of them are not capable of performing matching in real time on large databases. In our paper, we describe a method for image matching, which could be promising for the real time applications even on mobile devices.

The authors Taylor et al. have presented [1] a simple patch feature with a binary mask representation, which enables very fast matching at runtime – Histogram of Intensity Patches. Our approach presented in this paper is based on this HIPs descriptor. In our algorithm we use methods of detecting local features and building a set of HIPs descriptors. This algorithm is compatible with other algorithms already included in OpenCV library. The basic idea how to decrease the computation time is to build the descriptor in a way that the training process includes many viewpoints corresponding to varying rotation, scale and affine transformation. Hence, rotation, scale and affine invariance could be achieved in the training phase, the matching runtime process directly use the descriptor and no additional computation time is necessary. This is the fact, which makes some other methods slower and not capable for running in real time.

In the training process, we build a binary descriptor of a patch around the detected feature keypoint for all viewpoints. All descriptors are stored for a later use, so we do not need to go through the process of the training again. For the simulation of different image views, we use transformation provided by OpenCV library. However the training process takes several minutes to complete and use extra computing memory. We use the same approach on the acquired camera image, and then match the features by counting of the dissimilarity score, which is the result of bitwise operations between descriptors. The results with score less than threshold = 5 will be selected as good matches and used to find a homography using the RANSAC (Random sample consensus) algorithm.

Related work

There are several descriptors providing well matching probability. The most common are SIFT [11] [5] [6] (Scale-invariant feature transform), SURF [10] [5] (Speeded up robust features), BRIEF [8] (Binary robust independent elementary features) or ORB [9] (Oriented BRIEF). In this part we describe how SIFT and SURF work, as we use them in comparison to HIPs in our tests.

SIFT descriptor use for key-point detection Difference of Gaussian (DoG) [3]. DoG is used on two neighbour images from image pyramid. These two images are blurred and then subtracted. Key-points are detected as we search for local maxima/minima in the DoG pyramid. DoG is a faster approximation of Laplacian of Gaussian (LoG) [2] and also provide the scale invariance for SIFT descriptor. Despite the fact, computation time of DoG algorithm is still high to use it in real time tracking. SIFT descriptor divides surrounding pixels into areas of size 4×4, and computes histogram of oriented gradients with 8 bins. Therefore the resulting vector is 4*4*8 = 128 dimensional.

SURF descriptor also divide the area around detected key-point into 4×4 smaller areas. For each area it computes Haar wavelets in X and Y direction and their absolute values. Next, these values are normalised and stored in 64 dimensional vectors. To provide scale invariance, SURF detector instead of making image pyramid scales the filter.

PhonySIFT [7] [6] is modified SIFT for tracking on mobile devices. They replaced DoG method for detecting key-points with FAST [4] detector. Scale invariance, which was provided by DoG, was replaced by storing descriptor from different scales. Area around the key-point to fill descriptor was changed from 4×4 to 3×3. As in original SIFT, they compute histogram of oriented gradients with 4 bins, so the result vector is 36 dimensional instead of 128. Authors observe only 10% worse matching in comparison to original SIFT.

The results of our work on HIPs descriptor will also be presented at 17th Central European Seminar on Computer Graphics (CESCG) 2013. [12]

SIFT or SURF use floating point numbers for describing the area around the detected key-points. To optimize computational times, better approach is to use binary descriptors as HIPs, which we describe below.

Training process

To build a suitable descriptor to match selected image we need to pass the process of training. This process consists of detecting and describing the area around the feature key-point. To provide matching rotation and scale invariance, we build descriptors on more viewpoint bins of an image, which we want to detect by the algorithm. These viewpoint bins are simply created by warping of the reference image. For each bin, small rotations and transformations are performed with the aim of increased robustness. Created images need next to pass through key-point detector, then the binary descriptor of each key-point will be calculated.

Feature detecting

For each image viewpoint in a bin, local features key-points using FAST corner detector are detected.

In the next step, the appearance of each feature in all images of the bin will be sorted and top detected 50 to 100 features are selected. The used parameters of warping have to be stored since they are necessary to find out a position of the feature in the reference image.

Patch extracting and building the descriptor

Afterwe havedetected thetop 50to 100feature key-pointsinthe currentviewpointbin, the descriptor could be calculated. We form a sample grid of 8 x 8 pixels around each of most detected corners key-point on each image in viewpoint. Pixels in the position given by the sample grid will take a part in process of filling the descriptor. 8 x 8 pixels, i.e. 64 pixels will form the descriptor, which will be enough to determine good or bad matches using dissimilarity score.

Figure 1. Sample grid around detected key-point. 8×8 highlighted pixels are used to create descriptor.

To provide the matching more robust to light variations, the selected values are normalised and then quantised into 5 levels of intensities. Intensities of pixels in this grid are used to form the histogram. Histogram is created in a way, it represents frequency of intensity appearance at selected position in all grids around corresponding key-point detected on training images. The feature descriptor building process is as follows: we fill ”1” at selected position of the selected intensity level, if the intensity appearance in the histogram for this position is less than 5%. If selected intensity appears more frequently than 5%, we put ”0” at the corresponding position. This boundary of 5% is determined by authors of HIPs to be best for filling the descriptor.

The finished feature descriptor will need to take 5 bits for each one of 64 pixels. Therefore we need 40 bytes to store the descriptor values and another 4 bytes memory to store the feature position. For example, if we decide to form the descriptor out of 100 features in a single bin, we need 4400 bytes of memory. To detect an image in various position, we need to calculate several hundreds of bins with different transformations.

Matching

After we have created the descriptors for the detected features, we do the same procedure on a captured image. Because we built the binary descriptor in a way that we filled it with 1 if pixel rarely felt into the bin, we can match descriptors by a simple way of using bitwise operations and bit count. We simply AND each of descriptors level and then OR the results. This operation require 5 AND and 4 OR operations. Then we need to count number of set bits in our result, which provides us information about dissimilarity of descriptors.

s = ((R0&C0)k(R1&C1)k(R2&C2)k(R3&C3)k(R4&C4))(1)

Where number Ri means i-th intensity level of the descriptor made in the surroundings of a feature from the reference template image and Ci i-th intensity level of the descriptor from the camera image.

 dissimilarity score = countOfOnesInBitfield(s)(2)

To declare descriptors as a good match they need to have this dissimilarity score less than some threshold, typically 5. After we select all good matches, we use them to find homography using RANSAC found in OpenCV library. Next we draw matched features and show successful match on screen.

Tests and results

Our testing algorithm is made in C/C++ programming language using OpenCV library and runs on laptop with i7 3632 QM 2,20 GHz processor and 8GB of DDR5 1600MHz memory. We created 1 viewpoint bin consisted of 3 different scales and 2 clockwise and anticlockwise rotations from reference image. Each of generated image were also 5 times perspective transformed from each sides by small amounts. In sum, we got 315 transformed images to form the descriptor. This option is no optimized yet and will be investigated in our future research.

First, we took an image reference with the resolution 126 x 178 pixels and try to match it with the image from camera with resolution 320 x 240 pixels. Next chart shows the average time of computation of the matched images using our implementation of HIPs for 1 viewpoint bin and the average computation time for SIFT and SURF algorithm implemented in OpenCV library. HIPS descriptor was created from top 100 key-points detected on the reference image in a single bin, containing 315 images of small rotations, scales and perspective transformations.

Figure 2. Elapsed time of computation for matching the descriptors.

Related to the Figure 2, we can see that HIPs is running more than twice faster than SIFT. However for possible matching for more bins we have to pass through the process for each viewpoint, therefore time of computation will rise. The presented algorithm is promising, but still needs further optimisation in case of mobile platform.

Next, we considered to improve the time of computation by reducing the number of detected features used for the descriptor forming and matching. Taking less features and therefore creating less descriptors could improve computation time, but also can reduce the probability of a successful match. We have acquired 20 random images, which will takes part in our next test. Then we have set the number of features, which will be formed into descriptors, to 10, 25, 50 and 100. Next we have try to match a reference image with the 20 images taken before. We have evaluated the number of successful matches and also we have measured the time of computation needed for each image. In the next chart ( Figure 3.) you can see the results in %.

Figure 3. Average computation time required for successful matches.

We can see that the time of computation needed for the matching of one image increases significantly by increasing the number of selected features to form the descriptor. Otherwise, if only 25 features are selected, we can see only a small difference in successful matching ratio comparing with 100 selected features. Therefore we can decide that for our purposes with current rotations, scales and perspective transformations, there is a good trade-off to form the descriptor by using 25 to 50 selected features.

Next chart (in the Figure 4.) show average time in seconds needed for the matching in our test. The difference significantly grows with more features selected. We can choose to make descriptors from less features, but this test contains only one viewpoint bin and therefore the computational time seems to be still high. To decrease the matching time, there is an opportunity of forming created descriptors into a binary tree or making indexes in which we can search faster than in our current tests, where the search through the descriptors is linear.

Figure 4. Computation time for our test in seconds.

Conclusion and future work

As presented, the results achieved by using the HIPs descriptor seem to be promising, however there are still possible improvements in the algorithm and also in the implementation. These improvements should make the algorithm faster and suitable for real time matching in larger databases. Data are stored in memory, which refer to all different image warps and therefore the memory requirement is higher. In our implementation the memory requirement is still acceptable and manageable by mobile devices(around20to40megabytesfortrainingphase), butalsohereisaneedofanoptimization. The pros of this method is that we do not need to save any of image transformation during the evaluating process and it can be done just once in the training phase. The next possible improving, which could be done in our future work is an optimization of the algorithm by trying various transforming conditions on each bin. Our algorithm has run-time complexity of O(n*m) for matching now, where n is the number of descriptors detected on reference image and m number of descriptors created from image from camera. Our goal is to make the presented algorithm faster in the run-time and then integrate this method as a part of our augmented reality application on a mobile device.

Acknowledgement: KEGA 068UK-4/2011 UAPI

References

[1] Taylor, S., Rosten, E., Drummond, T.: Robust feature matching in 2.3 us. In Proceedings of Computer Vision and Pattern Recognition conference, June 20-25, 2009, s. 15-22.

[2] Dobeš, M.: Image processing and algorithms in C#. 1. edition. Praha. 2008. ISBN 978-807300-233-6

[3] Mikolajczyk, K., Schmid C.: Scale & Affine Invariant Interest Point Detectors. In International Journal of Computer Vision, vol. 60, 2004, no. 1, pp. 63-86.

[4] Rosten, E., Drummond T.: Machine learning for high-speed corner detection. In Proceedings of 9th European Conference on Computer Vision, Graz, Austria, May 7-13, 2006, pp. 430-443.

[5] Kottman, M.: Planar Object Detection using Local Feature Descriptors. In: Association of Computing Machinery bulletin, June 2011, vol. 3, no. 2, pp. 59-63.

[6] Wagner, D., Reitmayr, G., Mulloni, A., Drummond, T., Schmalstieg, D.: Pose tracking from natural features on mobile phones. ISMAR ’08 Proceedings of the 7th IEEE/ACM International Symposium on Mixed and Augmented Reality, 2008, pp. 125-134.

[7] Wagner, D., Reitmayr, G., Mulloni, A., Drummond, T., Schmalstieg, D.: Real-Time detection and tracking for augmented reality on mobile phones. In Visualization and Computer Graphics, vol. 16, 2010, no. 3, pp. 355-368.

[8] Calonder, M., Lepetit, V., Strecha, C., Fua, P.: BRIEF: Binary Robust Independent Elementary Features. In Proceedings of European Conference on Computer Vision, September 5-11, 2010, pp 778-792.

[9] Rublee, E., Rabaud, V., Konolige, K., Bradski, G.: ORB: an efficient alternative to SIFT or SURF. In Proceedings of Computer Vision (ICCV), 2011 IEEE International Conference , Barcelona, pp. 2564-2571.

[10] Bay, H., Tuytelaars, T., Luc Van Gool.: SURF: speeded up robust features. In Proceedings of 9th European Conference on Computer Vision, Graz, Austria, May 7-13, 2006, pp. 404-417.

[11] Lowe, David G.: Object recognition from local scale-invariant features. In Proceedings of the Seventh IEEE International Conference on Computer Vision, 1999, vol. 2, pp. 1150-1157.

[12] Jakab, M.: Augmented reality application on mobile device using descriptor based on histogram of intensity patches. To appear In: CESCG 2013. 17th Central European Seminar on Computer Graphics.


Source code:
http://vgg.fiit.stuba.sk/wp-uploads/2013/05/hips.zip

Posted on

CSS – Curvature Scale Space in OpenCV

Description

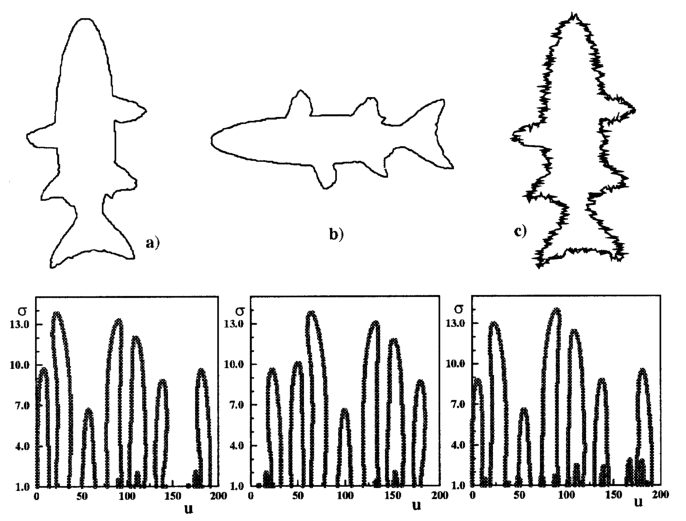
The goal of this project is to implement algorithm that creates curvature scale space (CSS) image of given shape using OpenCV library. “The CSS image consists of several arch-shape contours representing the inflection points of the shape as it is smoothed. The maxima of these contours are used to represent a shape. The CSS representation is robust with respect to scale, noise and change in orientation.”[1]

CSS representations for various curve modifications [1]

Process

  1. Find contour coordinates of given shape
  2. findContours(im, contours, CV_RETR_LIST, CV_CHAIN_APPROX_NONE );
    

    Following steps are repeated with increased sigma until there are no zero-crossing points:

  3. Gaussian kernel is the base for upcoming steps:
    transpose(getGaussianKernel(width, sigma, CV_64FC1), G);
    
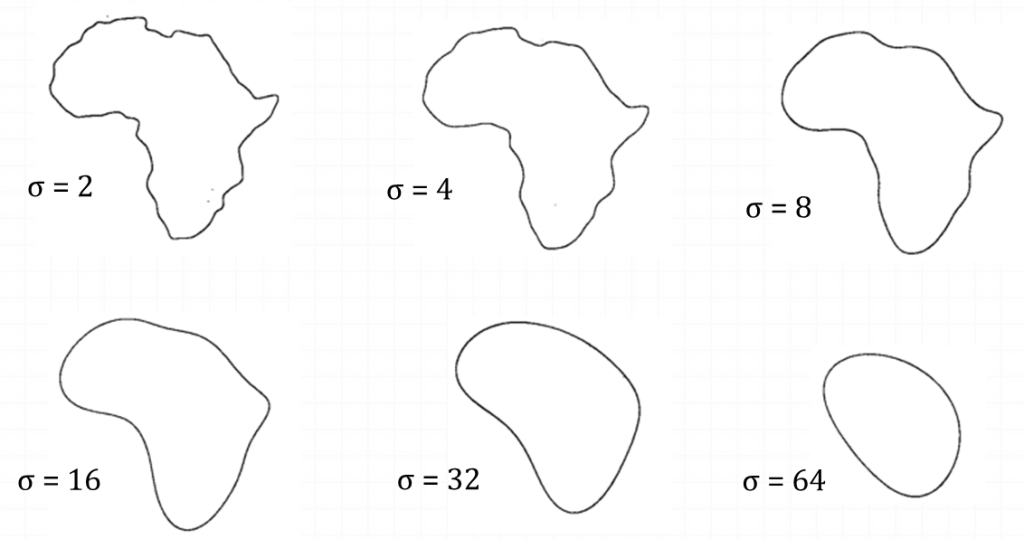
  4. Curve evolution can be computed by convolution of contour points with Gaussian kernel. Smoothed contour is not needed for CSS computation; it is used only to visualize the process:

    filter2D(X, Xsmooth, X.depth(), G);
    filter2D(Y, Ysmooth, Y.depth(), G);
    

    Curve evolution with increasing sigma [2]
  5. To compute 1st and 2nd derivation of contour points, Gaussian kernel derivations will be needed:
    Sobel(G, dG, G.depth(), 1, 0, 3);
    Sobel(G, ddG, G.depth(), 2, 0, 3);
    
  6. Convolution of contour points using derivatives of Gaussian kernel. According to OpenCV documentation: filter2D does actually computes correlation, not the convolution. That is, the kernel is not mirrored around the anchor point. If you need a real convolution, flip the kernel using flip() and set the new anchor to (kernel.cols – anchor.x – 1, kernel.rows – anchor.y – 1) :
    flip(dg, dg, 0);
    flip(ddg, ddg, 0);
    Point anchor(dg.cols - fwhm -1, dg.rows - 0 - 1);
    filter2D(X, dX, X.depth(), dG, anchor);
    filter2D(Y, dY, Y.depth(), dG, anchor);
    filter2D(X, ddX, X.depth(), ddG, anchor);
    filter2D(Y, ddY, Y.depth(), ddG, anchor);
    
  7. Finally, we calculate the curvature and find zero crossings:

    Curvature and inflection points of curve smoothed with sigma=16
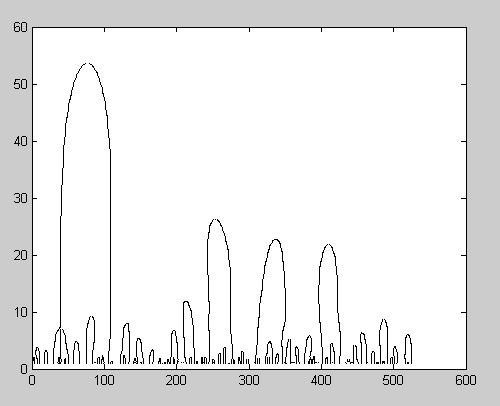
  8. Zero-crossing points are plotted to the final CSS image. X-axis represents position of point on the curve; Y-axis represents the value of sigma:
    Final CSS image with zero-crossing points for all sigmas

Practical Applications

  • Finding similar shapes  (Used as shape descriptor in MPEG-7 standard)
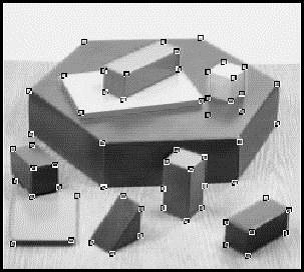
  • Corner detection
Example of cornes detection

References

[1] Sadegh Abbasi, Farzin Mokhtarian, Josef Kittler: Curvature Scale Space Image in Shape Similarity Retrieval. Multimedia Syst. 7(6): 467-476 (1999)

[2] Farzin Mokhtarian, Alan K. Mackworth: A Theory of Multiscale, Curvature-Based Shape Representation for Planar Curves. IEEE Trans. Pattern Anal. Mach. Intell. 14(8): 789-805 (1992)

Posted on

Hair segmentation

Description

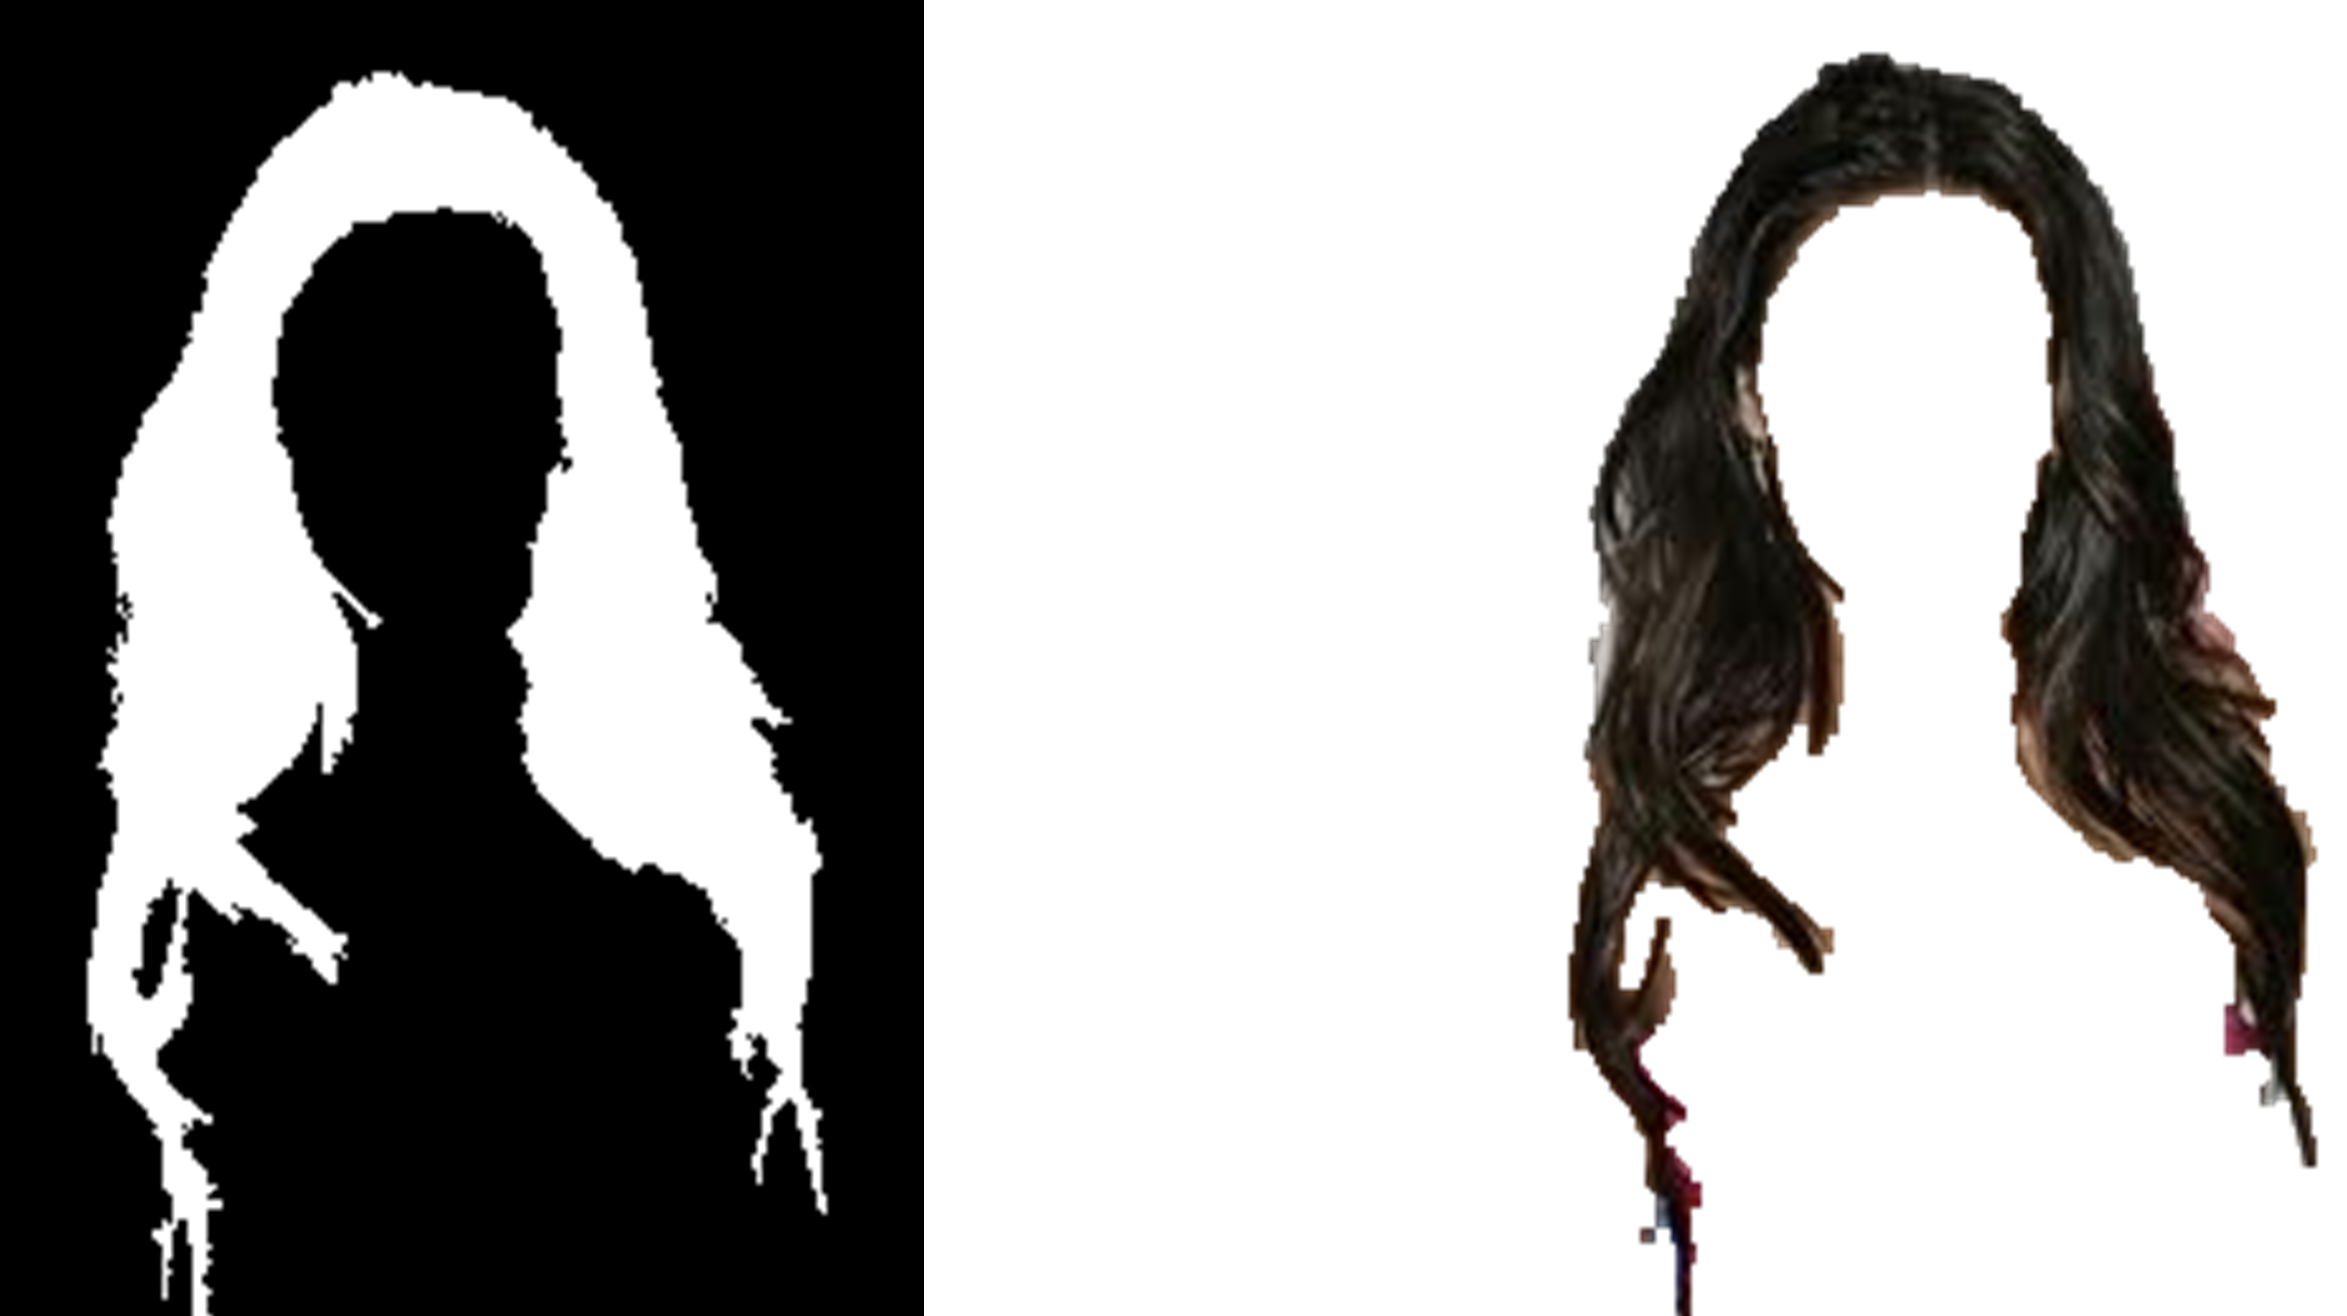
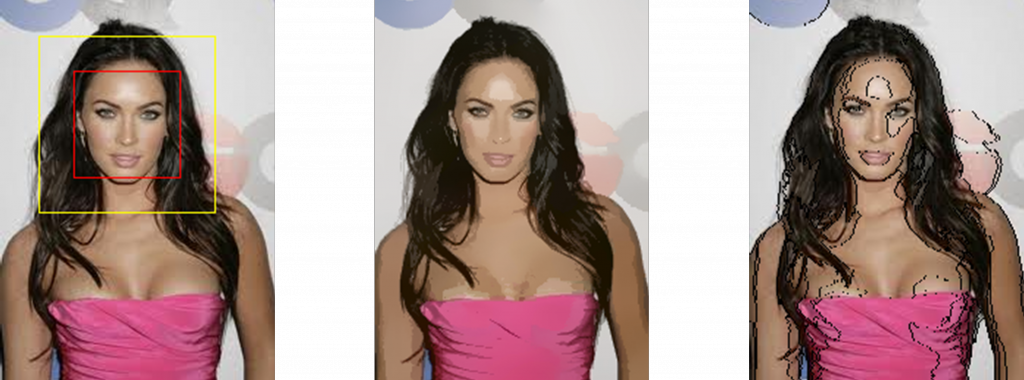
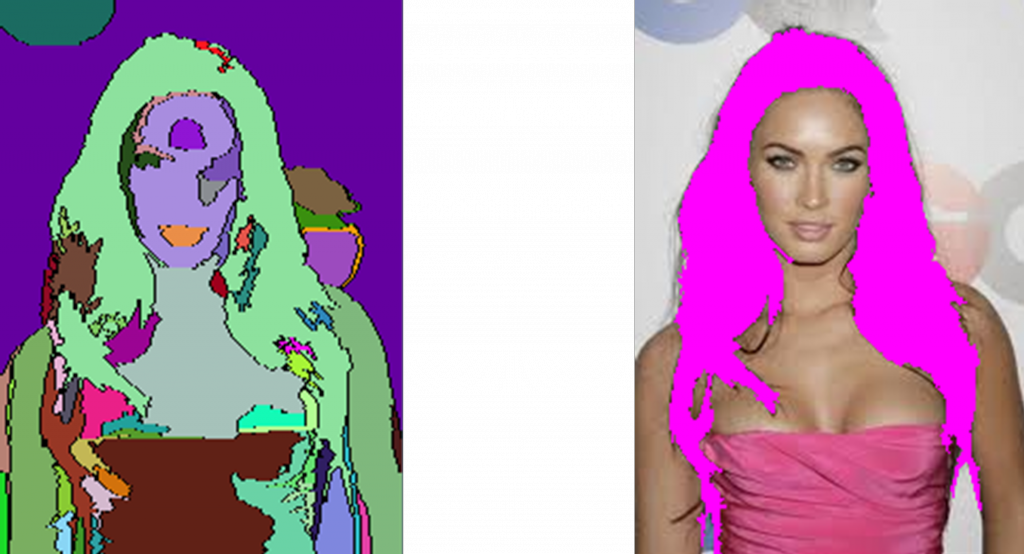
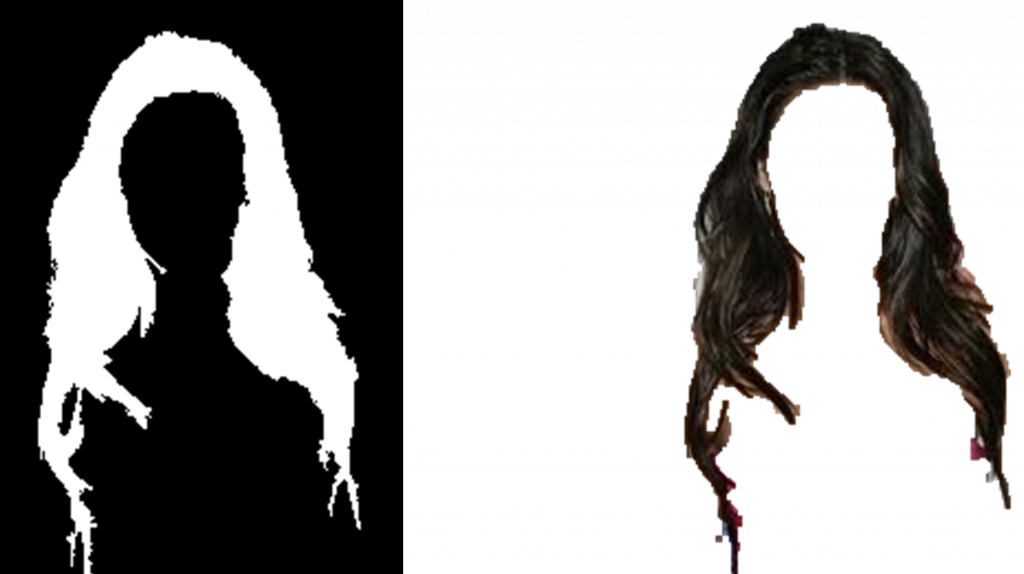
The project shows hair segmentation from photos. Important thing is to have an appropriate input image, where background and hair color must be different. Algorithm uses Mean Shift segmentation to segment input image into regions. Best regions are selected to be in the final image.

OpenCV function used

cvHaarDetectObjects, cvSplit, cvCalcHist, cvGetMinMaxHistValue, cvInRangeS

The process

  1. appropriate image selection
  2. face detection
  3. face segmentation (optional)
  4. Mean Shift image segmentation
  5. first region selection
  6. expansion of the first region
  7. final hair segmentation from image

Sample

Input image
From left: haar face detection, colors reduction, mean shift segmentation.
Initial hair region selection.
Left: neighboring regions, right: adding neighboring regions.
Left: mask created, right: Hair segmentation final image.
Posted on

Detection and removal of circular artifacts from photographs

Description

Reflecting flashlight from dust, snowflakes or raindrops can produce irritating circular artifacts. For its detecting and removing we propose process, where we use improved circle detection besides using houghCircles function. For removing detected artifacts we use morphological reduction.

Functions used

adaptiveThreshold, Canny, HoughCircles, findContours, fitEllipse, ImReconstruct

Process

Greyscale input image with circular artifacts.
Output image.

Limitation: Minimal circle size (15px )- Maximal circle size(30px)

  1. Preprocessing – Adaptive threshold
    medianBlur()
    adaptiveThreshold()
    OutputImg := InputImg + FilteredImg
    
  2. Detection with HoughCircles
    Canny()
    GaussianBlur()
    HoughCircles()
    Accept/ignore circles (based on size)
    
  3. Detection with Morphological reconstruction and contour analysis
    mask := InputImg
    marker := InputImg – degreeOfMorphreduct
    marker := inv(marker)
    morphologicalReconstruction(marker, mask)
    differenceImg := marker2 – marker1
    differenceImg := medianBlur(differenceImg)
    differenceImg := threshold(differenceImg)
    contour[] = findContours (differenceImg)
    ellipse[i] := fitEllipse(contour[i])
    accept/ignore circles (based on size and ellipse axes)
    draw white ellipse[i]
    draw black contour[i]
    crop Regions Of Interest
    opening(regionOfInterest[i])
    if countNonZero(regionOfInterest[i]) > threshold then accept; else ignore;
    
  4. Result

Posted on

Convolutional neural networks

Description

Convolutional Neural Networks(CNNs) are multi-layered neural networks with standard hidden layers and with at least one convolutional layer. They are suitable for visual processing because they exploit the tolopogy of inputs.

Because we are interested in more general structures of networks and layers, the CNN is implemented with automatic differentiation (AD) in mind. This means that one has to provide only the implementation of forward pass of any structure. It is important to note that AD is based on certainly different principle as finite differences. The important difference of AD is that it yields precise results.

Architecture

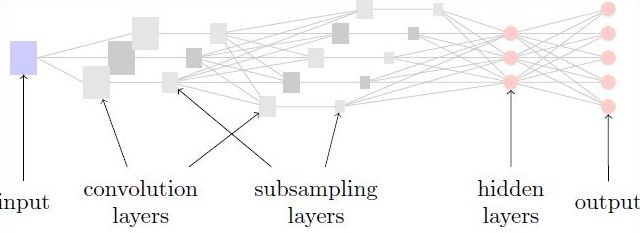
The architecture of convolutional networks is shown in figure 1. Convolutional layers are located right after inputs. After each convolutional layer the process of subsampling is performed. By subsampling we improve translational invariance and significantly reduce complexity. After convolutional layers, standard fully connected hidden layers are used. These are then mapped to desired outputs.

Architecture of convolutional networks.

When the signal passes into standard hidden layer, it is no longer meaningful to pass it again into another convolutional layers. However it can be meaningful to have heterogeneous layers consisting of convolutional and also standard units.

Experiments

Note that it is meaningful for input to be two-dimensional. We have used CNN for handwritten digits recognition of US Postal Service.

  • 2,5% human error rate
  • 2,0% best error rate: combination of multiple classifiers
  • 4,7% best achievement of our CNN

We note, that CNNs are sensitive to parameter settings including number and size of convolutional kernels. However, when properly set, CNNs perform well. We can see an example output of convolutional layers at figure 2.

Example of features extracted in the first convolutional layer.
Posted on

Frequency domain filtration

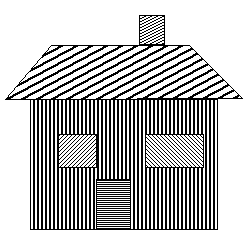
This post provides an example of image filtration and editing in the frequency domain. Practical methods of image spectrum conversion and Gaussian mask creation are described. The sample application is written in C++ using the OpenCV 2.x API. The full source code is also attached.

Image data transformation into the frequency domain

In frequency domain we can analyze the spectrum of signals.  The known Fourier transform is a linear transformation used for the conversion from time (e.g. audio signals in 1 dimension) or spatial (e.g. image in 2 dimensions) domain into the frequency domain. By the definition of Furier trasform is given, that the spectral  data are complex numbers in general.OpenCV library include functions for calculation of Discrete Fourier Transform of an input image into a complex matrix – spectrum.
The next sample function shows a possibility to use the filtration in frequency domain for the enhancement of the image. Optimal DFT size was achieved by the method “zero padding”.
Note: Resolution of complex output can be increased by multiplying M and N variables with a constant.

Mat computeDFT(Mat image) {
	Mat padded;
	int m = getOptimalDFTSize(image.rows);
	int n = getOptimalDFTSize(image.cols);
	// create output image of optimal size
	copyMakeBorder(image, padded, 0, m - image.rows, 0, n - image.cols, BORDER_CONSTANT, Scalar::all(0));
	// copy the source image, on the border add zero values
	Mat planes[] = { Mat_< float> (padded), Mat::zeros(padded.size(), CV_32F) };
	// create a complex matrix
	Mat complex;
	merge(planes, 2, complex);
	dft(complex, complex, DFT_COMPLEX_OUTPUT);  // fourier transform
	return complex;
}

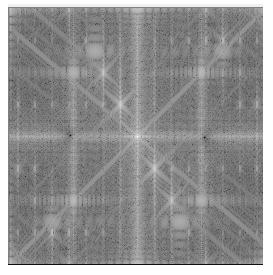
Once the complex matrix is generated, the visualization of spectrum can be done by  the OpenCV operation  magnitude (which is per-element matrix operation) and then by the conversion into the logarithmic scale for proper display.

Note: shift() function does the rearrangement of quadrants using SetROI() and CopyTo() functions of OpenCV API. See the full source code for more details.

void updateMag(Mat complex) {
	Mat magI;
	Mat planes[] = {
		Mat::zeros(complex.size(), CV_32F),
		Mat::zeros(complex.size(), CV_32F)
	};
	split(complex, planes); // planes[0] = Re(DFT(I)), planes[1] = Im(DFT(I))
	magnitude(planes[0], planes[1], magI); // sqrt(Re(DFT(I))^2 + Im(DFT(I))^2)
	// switch to logarithmic scale: log(1 + magnitude)
	magI += Scalar::all(1);
	log(magI, magI);
	shift(magI); // rearrage quadrants
	// Transform the magnitude matrix into a viewable image (float values 0-1)
	normalize(magI, magI, 1, 0, NORM_INF);
	imshow("spectrum", magI);
}

Processing

This project was designed as an interactive tool which can clear somelocal extremes in spectrum by multiplying it with a Gauss filter. OpenCV framework provides functions to handle mouse clicks and input trackballs, please see the full source code for more details.

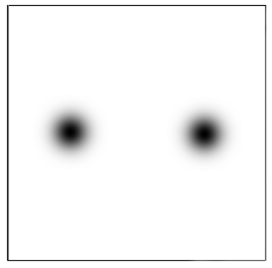
First of all we need to create a Gaussian mask, if we working with in frequency domain we need to consider that, the spectrum is symmetric, so the mask is also need to mirrored by image center.

A symmetric Gaussian mask

For processing image in frequency domain, we would like use the Gaussian mask as a complex matrix and multiply it with the original image’s spectrum.

Mat mask = createGausFilterMask(complex.size(), x, y, kernel_size, true, true);
shift(mask);  // rearrange quadrants of mask

Mat planes[] = {
	Mat::zeros(complex.size(), CV_32F),
	Mat::zeros(complex.size(), CV_32F)
};
Mat kernel_spec;
planes[0] = mask; // real
planes[1] = mask; // imaginar
merge(planes, 2, kernel_spec);

mulSpectrums(complex, kernel_spec, complex, DFT_ROWS); //only DFT_ROWS flag is accepted

Results

The backward transformation from the frequency domain is handled by using inverse DFT.

void updateResult(Mat complex)
{
	Mat result;
	idft(complex, result);
	// equivalent to:
	// dft(complex, result, DFT_INVERSE + DFT_SCALE);
	Mat planes[] = {
		Mat::zeros(complex.size(), CV_32F),
		Mat::zeros(complex.size(), CV_32F)
	};
	split(result, planes); // planes[0] = Re(DFT(I)), planes[1] = Im(DFT(I))
	magnitude(planes[0], planes[1], result); // sqrt(Re(DFT(I))^2 + Im(DFT(I))^2)
	normalize(result, result, 0, 1, NORM_MINMAX);
	imshow("result", result);
}
Sample result (cropped)

Practical samples

Watch the Sample screen video

Sample 1: digitally transmitted image with periodic noise
Sample 2: scanned postcard

Further reading

Posted on

Frequency domain filtration – source

#include 

using namespace cv;
using namespace std; 

void onMouse( int event, int x, int y, int, void* param);
void updateMag(Mat complex);
void updateResult(Mat complex);

Mat computeDFT(Mat image);
Mat createGausFilterMask(Size mask_size, int x, int y, int ksize, bool normalization, bool invert);
void shift(Mat magI);

int kernel_size = 0;

int main( int argc, char** argv )
{ 

	String file;
	file = " << SAMPLE FILE >>";

	Mat image = imread(file, CV_LOAD_IMAGE_GRAYSCALE);
	namedWindow( "Orginal window", CV_WINDOW_AUTOSIZE  );// Create a window for display.
	imshow( "Orginal window", image );                   // Show our image inside it.

	Mat complex = computeDFT(image);

	namedWindow( "spectrum", CV_WINDOW_AUTOSIZE );
    createTrackbar( "Gausian kernel size", "spectrum", &kernel_size, 255, 0 );
    setMouseCallback( "spectrum", onMouse, &complex);

	updateMag(complex);			// compute magnitude of complex, switch to logarithmic scale and display...
	updateResult(complex);		// do inverse transform and display the result image
	waitKey(0);	

	return 0;
}

void onMouse( int event, int x, int y, int, void* param)
{
    if( event != CV_EVENT_LBUTTONDOWN )
        return;
	// cast *param to use it local
	Mat* p_complex = (Mat*) param;
	Mat complex = *p_complex;

	Mat mask = createGausFilterMask(complex.size(), x, y, kernel_size, true, true);
	// show the kernel
	imshow("gaus-mask", mask);

	shift(mask); 

	Mat planes[] = {Mat::zeros(complex.size(), CV_32F), Mat::zeros(complex.size(), CV_32F)};
	Mat kernel_spec;
	planes[0] = mask; // real
	planes[1] = mask; // imaginar
    merge(planes, 2, kernel_spec);

	mulSpectrums(complex, kernel_spec, complex, DFT_ROWS); // only DFT_ROWS accepted

	updateMag(complex);		// show spectrum
	updateResult(complex);		// do inverse transform

	*p_complex = complex;

	return;
}

void updateResult(Mat complex)
{
	Mat work;
	idft(complex, work);
//	dft(complex, work, DFT_INVERSE + DFT_SCALE);
	Mat planes[] = {Mat::zeros(complex.size(), CV_32F), Mat::zeros(complex.size(), CV_32F)};
	split(work, planes);                // planes[0] = Re(DFT(I)), planes[1] = Im(DFT(I))

	magnitude(planes[0], planes[1], work);	  // === sqrt(Re(DFT(I))^2 + Im(DFT(I))^2)
	normalize(work, work, 0, 1, NORM_MINMAX);
	imshow("result", work);
}

void updateMag(Mat complex )
{

	Mat magI;
	Mat planes[] = {Mat::zeros(complex.size(), CV_32F), Mat::zeros(complex.size(), CV_32F)};
	split(complex, planes);                // planes[0] = Re(DFT(I)), planes[1] = Im(DFT(I))

    magnitude(planes[0], planes[1], magI);    // sqrt(Re(DFT(I))^2 + Im(DFT(I))^2)

	// switch to logarithmic scale: log(1 + magnitude)
	magI += Scalar::all(1);
    log(magI, magI);

	shift(magI);
    normalize(magI, magI, 1, 0, NORM_INF); // Transform the matrix with float values into a
                                              // viewable image form (float between values 0 and 1).
    imshow("spectrum", magI);
}

#include "dft_routines.h";

Mat computeDFT(Mat image) {
	// http://opencv.itseez.com/doc/tutorials/core/discrete_fourier_transform/discrete_fourier_transform.html
	Mat padded;                            //expand input image to optimal size
    int m = getOptimalDFTSize( image.rows );
    int n = getOptimalDFTSize( image.cols ); // on the border add zero values
    copyMakeBorder(image, padded, 0, m - image.rows, 0, n - image.cols, BORDER_CONSTANT, Scalar::all(0));
	Mat planes[] = {Mat_(padded), Mat::zeros(padded.size(), CV_32F)};
	Mat complex;
    merge(planes, 2, complex);         // Add to the expanded another plane with zeros
	dft(complex, complex, DFT_COMPLEX_OUTPUT);  // furier transform
	return complex;
}

Mat createGausFilterMask(Size mask_size, int x, int y, int ksize, bool normalization, bool invert) {
	// Some corrections if out of bounds
	if(x < (ksize / 2)) {
		ksize = x * 2;
	}
	if(y < (ksize / 2)) {
		ksize = y * 2;
	}
	if(mask_size.width - x < ksize / 2 ) {
		ksize = (mask_size.width - x ) * 2;
	}
	if(mask_size.height - y < ksize / 2 ) {
		ksize = (mask_size.height - y) * 2;
	}

	// call openCV gaussian kernel generator
	double sigma = -1;
	Mat kernelX = getGaussianKernel(ksize, sigma, CV_32F);
	Mat kernelY = getGaussianKernel(ksize, sigma, CV_32F);
	// create 2d gaus
	Mat kernel = kernelX * kernelY.t();
	// create empty mask
	Mat mask = Mat::zeros(mask_size, CV_32F);
	Mat maski = Mat::zeros(mask_size, CV_32F);

	// copy kernel to mask on x,y
	Mat pos(mask, Rect(x - ksize / 2, y - ksize / 2, ksize, ksize));
	kernel.copyTo(pos);

	// create mirrored mask
	Mat posi(maski, Rect(( mask_size.width - x) - ksize / 2, (mask_size.height - y) - ksize / 2, ksize, ksize));
	kernel.copyTo(posi);
	// add mirrored to mask
	add(mask, maski, mask);

	// transform mask to range 0..1
	if(normalization) {
		normalize(mask, mask, 0, 1, NORM_MINMAX);
	}

	// invert mask
	if(invert) {
		mask = Mat::ones(mask.size(), CV_32F) - mask;
	}

	return mask;
}

void shift(Mat magI) {

    // crop if it has an odd number of rows or columns
	magI = magI(Rect(0, 0, magI.cols & -2, magI.rows & -2));

	int cx = magI.cols/2;
    int cy = magI.rows/2;

    Mat q0(magI, Rect(0, 0, cx, cy));   // Top-Left - Create a ROI per quadrant
    Mat q1(magI, Rect(cx, 0, cx, cy));  // Top-Right
    Mat q2(magI, Rect(0, cy, cx, cy));  // Bottom-Left
    Mat q3(magI, Rect(cx, cy, cx, cy)); // Bottom-Right

    Mat tmp;                            // swap quadrants (Top-Left with Bottom-Right)
    q0.copyTo(tmp);
    q3.copyTo(q0);
    tmp.copyTo(q3);
    q1.copyTo(tmp);                     // swap quadrant (Top-Right with Bottom-Left)
    q2.copyTo(q1);
    tmp.copyTo(q2);
}
Posted on

Hazardous sign detection for safety applications in traffic monitoring

Wanda Benesova*a, Michal Kottman*a, Oliver Sidla*b
*a Faculty of Informatics and Information Technologies, Slovak University of Technology, Bratislava, Slovakia;*b SLR Engineering OG, Graz, Austria

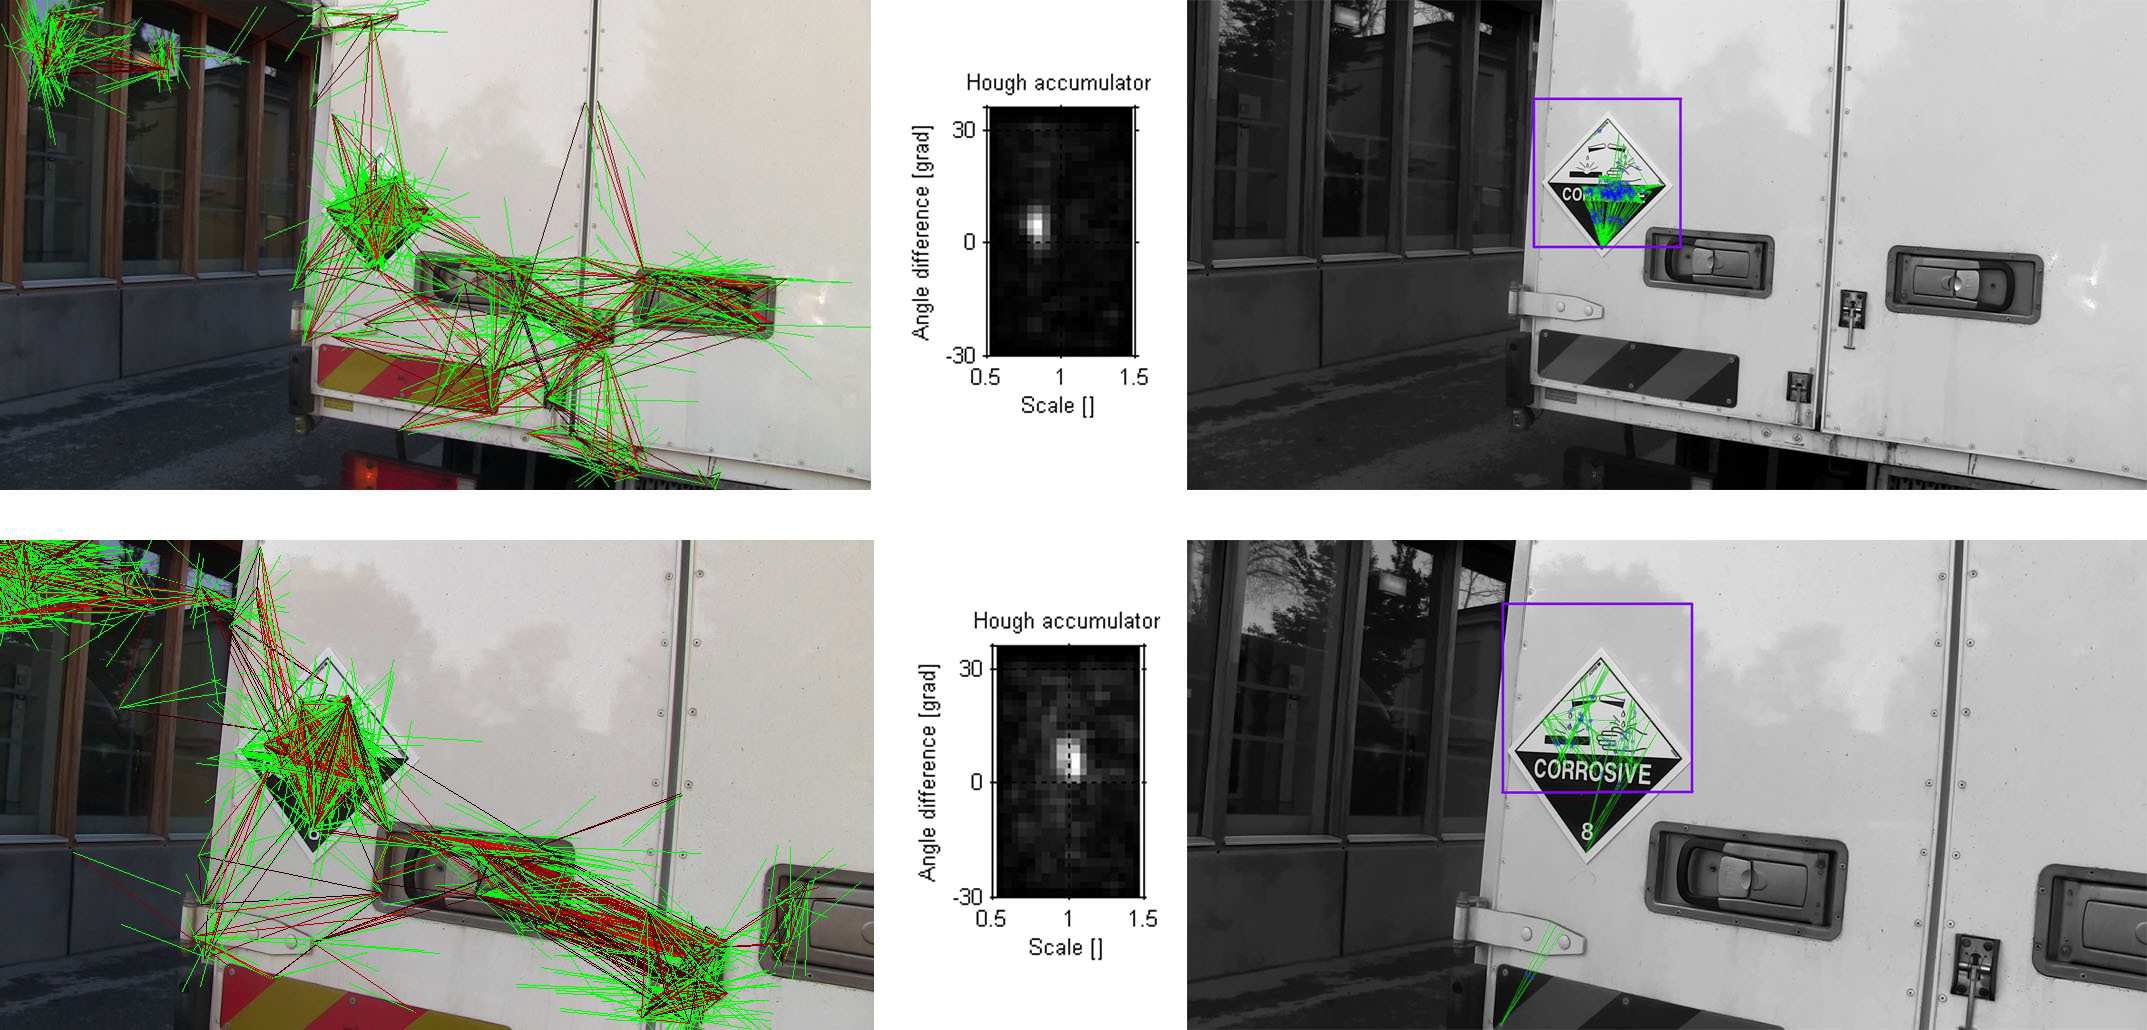
Abstract. The transportation of hazardous goods in public streets systems can pose severe safety threats in case of accidents. One of the solutions for these problems is an automatic detection and registration of vehicles which are marked with dangerous goods signs. We present a prototype system which can detect a trained set of signs in high resolution images under real-world conditions. This paper compares two different methods for the detection: bag of visual words (BoW) procedure and our approach presented as pairs of visual words with Hough voting.
The results of an extended series of experiments are provided in this paper. The experiments show that the size of visual vocabulary is crucial and can significantly affect the recognition success rate. Different code-book sizes have been evaluated for this detection task. The best result of the first method BoW was 67% successfully recognized hazardous signs, whereas the second method proposed in this paper – pairs of visual words and Hough voting – reached 94% of correctly detected signs. The experiments are designed to verify the usability of the two proposed approaches in a real-world scenario.

Keywords: Object detection, Local descriptors, SIFT, Visual words, Bag of visual words, Hough voting


Paper is available at SPIE proceedings:
http://proceedings.spiedigitallibrary.org/proceeding.aspx?articleid=1284399

Citation:
Wanda Benesova, Michal Kottman and Oliver Sidla, “Hazardous sign detection for safety applications in traffic monitoring”, Proc. SPIE 8301, 830109 (2012); pdf

Posted on

Real-time pose invariant logo and pattern detection

Oliver Sidla, Michal Kottman, Vanda Benesova

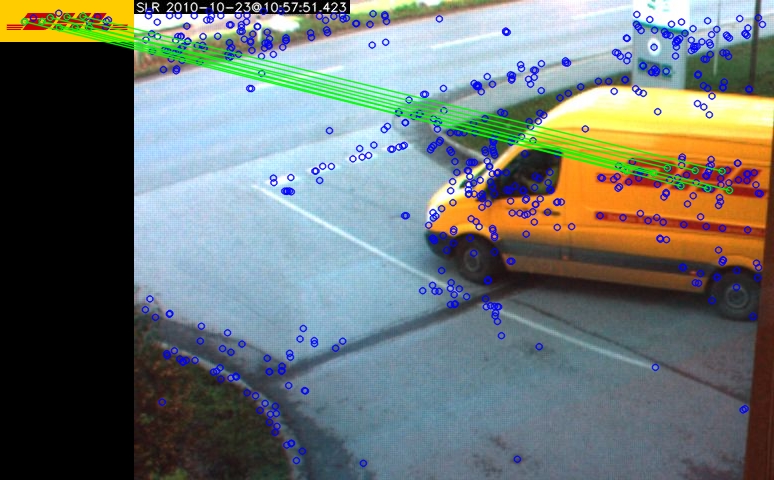
Abstract. In this work we have tested several keypoint/feature descriptor combinations for logo detection in order to estimate the robustness of different algorithms with respect to logo type and image quality. Our tests have shown that the well established SURF/SURF combination seems to perform best, followed by Calonder’s keypoint detector/Random Fern combination. The authors still believe that the LDETECTOR/Fern combination, especially when using the compressed signature framework is used (which has not yet been implemented for this test) bears a large potential. Its speed advantage and ability for fast online learning should make it an interesting alternative to SURF/SURF.


pdf

Posted on

Interactive Visualization of Abstract Data

Martin Å perka, Peter Kapec

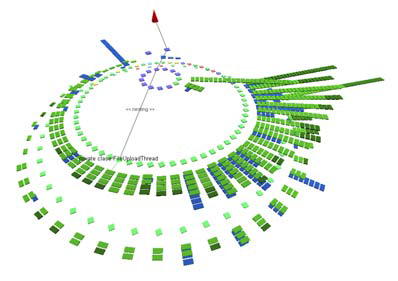
Abstract. Information visualization is a large research area. Currently with more powerful computers and graphic accelerators more and more visualization techniques become part of daily use. In this paper we discus visualization of abstract data – data that is difficult or impossible to manually grasp. Using visualization of abstract data we can gain better insight. We present several experimental methods for visualizing graphs and show possible applications in the software visualization field.

INTERACTIVE VISUALIZATION OF ABSTRACT DATA


Å perka, Martin – Kapec, Peter: Interactive Visualization of Abstract Data.
In: Science & Military.- Vol. 5, No. 1 (2010), s. 84-90