Posted on

Visualizing graph structures using soap bubbles

Bc. Ľuboš Ukrop

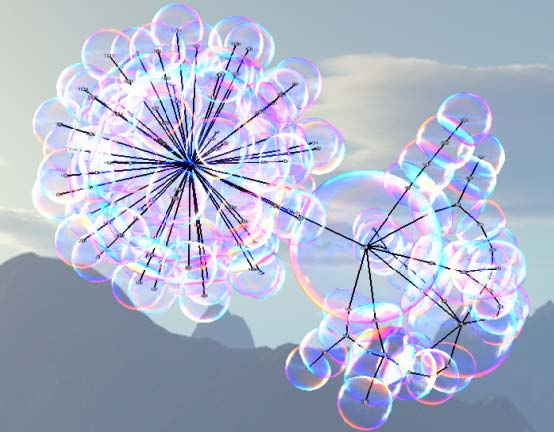
Abstract. Lots of information has structural character with some kind of relations. This type of information could naturally be represented by the graphs. A common way to enhance human understanding of graph is to visualize it. Many studies have already been devoted to this area, with most of them following conventional graph drawing techniques. In this thesis we present an experimental algorithm based on the springembedder technique, which tries to visualize graph structures using realistically rendered 3D soap bubble clusters. For its demonstration, a simple interactive visualization system was implemented. The process of system and algorithm development along with capabilities and issues connected with its use is discussed in detail.

Visualization of chosen graphs from Rome set.
Visualization without space restrictions.
Visualization with active space restrictions.
Visualization of software artifact graph.
Posted on

Visualization of program execution in 3D environment

Bc. Ivan Ruttkay-Nedecký

Abstract. Program execution consists of many abstract processes. In order to understand the whole program, one has to understand these processes first. A good imagination is required. Here visualization takes its part. This work discusses visualization of program execution in 3D environment, which should help to understand algorithms contained in programs. The work describes monitoring of program execution as a sequence of events – method execution, setting a field, a class instance construction etc. Extraction of relevant information for visualization is described. Then the work deals with visualization of these events. It looks for a way, how to visualize program elements (class, instance, method, field) and relations between them (class and its instances, fields and methods) effectively. The work deals with visualization of program execution as a control flow and data flow animation.

Animation in created system.

Entities closer to the camera have their full description. Others have only their name.

Posted on

Software development in 3D space

Bc. Martin Ludvík

Abstract. Software development and maintenance is very expensive, and the issues related to the  intellectual understanding associated with the development of new programs are growing at a fast pace. Previous research has shown, that using 3D software visualizations in this field can lead to several advantages. Yhis project’s goal is to analyze current situation in domain of software visualization and visual programming. It deals with various graphics representations of software and corresponding interaction techniques as well. It is finding alternative approaches to software development using visualization and interaction in 3D space.

Program structure.
Modules
Rectangle class.
Posted on

Representation of programs in graphs and their execution

Bc. Michal Kottman

Abstract. This work concentrates on the problematics of visual programming and visual programming languages as a means for the creation, editing and execution of visual programs. It lists several advantages and disadvantages of this approach. It provides necessary definitions and states the classification of visual programming languages and their paradigms. It also explains several means of formal visual language specification. Existing visual environments and languages are analyzed and their distinguishing traits are explained. It then addresses the representation of programs with the means of graphs and the creation of such graphs. A new notation for representing software based on hypergraphs is presented. A new visual language is specified based on presented notation, together with it’s syntax and execution model. Finally, a visual programming environment for the specified language is presented. It enables the user to create, modify and run programs based on the specified language.

Import of existing code to Vilie.
Detail of log function.
Selected functions from LuaDist project.
Posted on

Data visualization using sky metaphor

Bc. Martin Jakubéci

Abstract. The basis of every visualization is data, which can have different forms. Interesting are more complicated structures like common graphs, their generalization in form of hypergraphs and multidimensional data. Hypergraphs have big possibilities, but are not used very often. They could be used for representation of complicated relations, for example ontologies using topic maps. Important aspects of visualization are interaction and clustering of large data. Data visualization can use different metaphors. This approach should make the data more familiar to user by visualization using known images. This diploma thesis brings a new approach to 3D visualization of hypergraphs and multidimensional data using sky metaphor.

A visualization of an existing software system using nebulae visualization of hypergraph representation
Visualization of multi-dimenstional data
Posted on

Hand Tracking and Gesture Recognition Using Echo State Neural Networks

Peter Fillo

recognizerFilloHand Tracking and Gesture Recognition Using Echo State Neural Networks. Tracking an object in a video sequence is a complex problem which presents one of the fundamental task of image processing. One of the many use cases is controlling using hand gestures in Human-Computer Interaction. This paper introduces real-time hand recognition and tracking in video sequence with a classification of performed hand gestures. Hand recognition is based on foreground segmentation and skin region detection. Attributes of hand movements are being recorded and used as an input to a echo state neural network which performs hand gesture classification. Work presents proposed tracking algorithm and first results of gesture recognition.