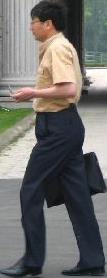
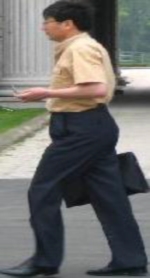
This project focuses on preprocessing of training images for pedestrian detection. The goal is to train a model of a pedestrian detection. Histogram of oriented gradients HOG has been used as descriptor of image features. Support vector machine SVM has been used to train the model.
Example:
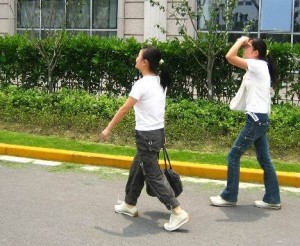
There are several ways to cut train example from source:
- using simple bounding rectangle
- adding “padding†around simple bounding rectangle
- preserve given aspect ratio
- using only upper half of pedestrian body
At first, the simple bounding rectangle around pedestrian has been determined. Annotation of training dataset can be used if it is available. In this case a segmentation annotation in form of image mask has been used. Bounding box has been created from image mask using contours (if multiple contours for pedestrian has been found, they were merged to one).);
findContours(mask, contours, CV_RETR_TREE, CV_CHAIN_APPROX_SIMPLE);
boundRect[k] = boundingRect(Mat(contours[k]));
HOG descriptors has been computed using OpenCV function hog.compute(), where descriptor parameters has been set like this:
Size win_size = Size(64, 128);
HOGDescriptor hog = HOGDescriptor(win_size, Size(16, 16), Size(8, 8), Size(8, 8), 9);
Window width = 64 px, window height = 128 px, block size = 16×16 px, block stride = 8×8 px, cell size = 8×8 px and number of orientation bins = 9.
Each input image has been re-scaled to fit the window size.
1.) Image, which had been cut using simple bounding rectangle, has been resized to fit aspect ratio of descriptor window.
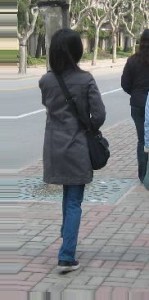
2.) In the next approach the simple bounding rectangle has been enlarged to enrich descriptor vector with background information. Padding of fixed size has been added to each side of image. When the new rectangle exceeded the borders of source image, the source image has been enlarged by replication of marginal rows and columns.
if (params.add_padding)
// Apply padding around patches, handle borders of image by replication
{
	l -= horizontal_padding_size;
	if (l < 0)
	{
		int addition_size = -l;
		copyMakeBorder(timg, timg, 0, 0, addition_size, 0, BORDER_REPLICATE);
		l = 0;
		r += addition_size;
	}
	t -= vertical_padding_size;
	if (t < 0)
	{
		int addition_size = -t;
		copyMakeBorder(timg, timg, addition_size, 0, 0, 0, BORDER_REPLICATE);
		t = 0;
		b += addition_size;
	}
	r += horizontal_padding_size;
	if (r > = timg.size().width)
	{
		int addition_size = r - timg.size().width + 1;
		copyMakeBorder(timg, timg, 0, 0, 0, addition_size, BORDER_REPLICATE);
	}
	b += vertical_padding_size;
	if (b > = timg.size().height)
	{
		int addition_size = b - timg.size().height + 1;
		copyMakeBorder(timg, timg, 0, addition_size, 0, 0, BORDER_REPLICATE);
	}
	allBoundBoxesPadding[i] = Rect(Point(l, t), Point(r, b));
}
3. In the next approach the aspect ratio of descriptor window has been preserved while creating the cutting bounding rectangle (so pedestrian were not deformed). In this case the only necessary padding has been added.
4. In the last approach only the half of pedestrian body has been used.
int hb = t + ((b - t) / 2);
allBoundBoxes[i] = Rect(Point(l, t), Point(r, hb));
NG rng(12345);
static const int MAX_TRIES = 10;
int examples = 0;
int tries = 0;
int rightBoundary = img.size().width - params.neg_example_width / 2;
int leftBoundary = params.neg_example_width / 2;
int topBoundary = params.neg_example_height / 2;
int bottomBoundary = img.size().height - params.neg_example_height / 2;
while (examples < params.negatives_per_image && tries < MAX_TRIES)
{
	int x = rng.uniform(leftBoundary, rightBoundary);
	int y = rng.uniform(topBoundary, bottomBoundary);
	bool inBoundingBoxes = false;
	for (std::vector::iterator it = allBoundBoxes.begin();
		it != allBoundBoxes.end();
		it++)
	{
		if (it->contains(Point(x, y)))
		{
			inBoundingBoxes = true;
			break;
		}
	}
	if (inBoundingBoxes == false) {
		Rect rct = Rect(Point((x - params.neg_example_width / 2), (y - params.neg_example_height / 2)), Point((x + params.neg_example_width / 2), (y + params.neg_example_height / 2)));
		boost::filesystem::path file_neg = (params.negatives_target_dir_path / img_path.stem()).string() + "_" + std::to_string(examples) + img_path.extension().string();
		imwrite(file_neg.string(), img(rct));
		examples++;
	}
	tries++;
}
SVM model has been learned using Matlab function fitcsvm(). The single descriptor vector has been computed:
ay = SVMmodel.Alpha .* SVMmodel.SupportVectorLabels;
sv = transpose(SVMmodel.SupportVectors);
single = sv*ay;
% Append bias
single = vertcat(single, SVMmodel.Bias);
% Save vector to file
dlmwrite(model_file, single,'delimiter','\n');
Single descriptor vector has been loaded and set
( hog.setSVMDetector(descriptor_vector) ) in detection algorithm which used the OpenCV function hog.detectMultiScale() to detect occurrences on multiple scale within whole image.
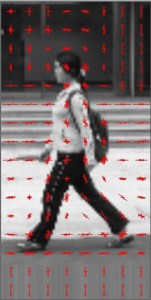
HOG visualization
As a part of project, the HOG descriptor visualization has been implemented. See algorithm bellow. Orientations and magnitudes of gradients are visualized by lines at each position (cell). In first part of algorithm all values from normalization over neighbor blocks at given position has been merged together. Descriptor vector of size 9×4 for one position has yielded vector of size 9.
void visualize_HOG(std::string file_path, cv::Size win_size = cv::Size(64, 128), int
	visualization_scale = 4)
{
	using namespace cv;
	Mat img = imread(file_path, CV_LOAD_IMAGE_GRAYSCALE);
	// resize image (size must be multiple of block size)
	resize(img, img, win_size);
	HOGDescriptor hog(win_size, Size(16, 16), Size(8, 8), Size(8, 8), 9);
	vector descriptors;
	hog.compute(img, descriptors, Size(0, 0), Size(0, 0));
	size_t cell_cols = hog.winSize.width / hog.cellSize.width;
	size_t cell_rows = hog.winSize.height / hog.cellSize.height;
	size_t bins = hog.nbins;
	// block has size: 2*2 cell
	size_t block_rows = cell_rows - 1;
	size_t block_cols = cell_cols - 1;
	size_t block_cell_cols = hog.blockSize.width / hog.cellSize.width;
	size_t block_cell_rows = hog.blockSize.height / hog.cellSize.height;
	size_t binspercellcol = block_cell_rows * bins;
	size_t binsperblock = block_cell_cols * binspercellcol;
	size_t binsperblockcol = block_rows * binsperblock;
	struct DescriptorSum
	{
		vector bin_values;
		int components = 0;
		DescriptorSum(int bins)
		{
			bin_values = vector(bins, 0.0f);
		}
	};
	vector average_descriptors = vector(cell_cols, vector(cell_rows, DescriptorSum(bins)));
	// iterate over block columns
	for (size_t col = 0; col < block_cols; col++)
	{
		// iterate over block rows
		for (size_t row = 0; row < block_rows; row++)
		{
			// iterate over cell columns of block
			for (size_t cell_col = 0; cell_col < block_cell_cols; cell_col++)
			{
				// iterate over cell rows of block
				for (size_t cell_row = 0; cell_row < block_cell_rows; cell_row++)
				{
					// iterate over bins of cell
					for (size_t bin = 0; bin < bins; bin++)
					{
						average_descriptors[col + cell_col][row + cell_row].bin_values[bin] += descriptors[(col*binsperblockcol) + (row*binsperblock) + (cell_col*binspercellcol) + (cell_row*bins) + (bin)];
					}
					average_descriptors[col + cell_col][row + cell_row].components++;
				}
			}
		}
	}
	resize(img, img, Size(hog.winSize.width * visualization_scale, hog.winSize.height * visualization_scale));
	cvtColor(img, img, CV_GRAY2RGB);
	Scalar drawing_color(0, 0, 255);
	float line_scale = 2.f;
	int cell_half_width = hog.cellSize.width / 2;
	int cell_half_height = hog.cellSize.height / 2;
	double rad_per_bin = M_PI / bins;
	double rad_per_halfbin = rad_per_bin / 2;
	int max_line_length = hog.cellSize.width;
	// iterate over columns
	for (size_t col = 0; col < cell_cols; col++)
	{
		// iterate over cells in column
		for (size_t row = 0; row < cell_rows; row++)
		{
			// iterate over orientation bins
			for (size_t bin = 0; bin < bins; bin++)
			{
				float actual_bin_strength = average_descriptors[col][row].bin_values[bin] / average_descriptors[col][row].components;
				// draw lines
				if (actual_bin_strength == 0)
					continue;
				int length = static_cast(actual_bin_strength * max_line_length * visualization_scale * line_scale);
				double angle = bin * rad_per_bin + rad_per_halfbin + (M_PI / 2.f);
				double yrange = sin(angle) * length;
				double xrange = cos(angle) * length;
				Point cell_center;
				cell_center.x = (col * hog.cellSize.width + cell_half_width) * visualization_scale;
				cell_center.y = (row * hog.cellSize.height + cell_half_height) * visualization_scale;
				Point start;
				start.x = cell_center.x + static_cast(xrange / 2);
				start.y = cell_center.y + static_cast(yrange / 2);
				Point end;
				end.x = cell_center.x - static_cast(xrange / 2);
				end.y = cell_center.y - static_cast(yrange / 2);
				line(img, start, end, drawing_color);
			}
		}
	}
	char* window = "HOG visualization";
	cv::namedWindow(window, CV_WINDOW_AUTOSIZE);
	cv::imshow(window, img);
	while (true)
	{
		int c;
		c = waitKey(20);
		if ((char)c == 32)
		{
			break;
		}
	}
}
