Bc. Martin Jakubéci
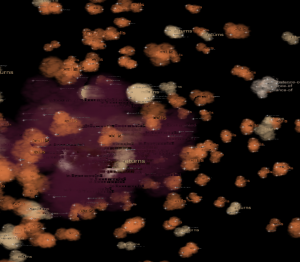
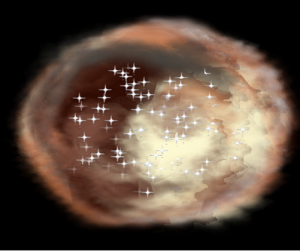
Abstract. The basis of every visualization is data, which can have different forms. Interesting are more complicated structures like common graphs, their generalization in form of hypergraphs and multidimensional data. Hypergraphs have big possibilities, but are not used very often. They could be used for representation of complicated relations, for example ontologies using topic maps. Important aspects of visualization are interaction and clustering of large data. Data visualization can use different metaphors. This approach should make the data more familiar to user by visualization using known images. This diploma thesis brings a new approach to 3D visualization of hypergraphs and multidimensional data using sky metaphor.

